Giving spacing between graphs in shiny output

Hi R Community,
I have a dashboard ready with me, but the problem I am facing is that the graphs don't appear in proper spacing. Two graphs appear as continuous as shown in the screenshot below. The scatter plot and the boxplots need to have some gap between them. I want to set spacing between these graphs so that the users can differentiate it. How can I do this? The reprex of the dashboardbody is below:

dashboardBody(
    tabsetPanel(
      tabPanel(title = "Summary Page-1",
               fluidRow(
                 column(6,plotlyOutput("plot1",height = 600,width = 800)),
                 column(6,plotlyOutput("plot2",height = 600,width = 800))))

Hi
try width='100%'
instead of
width = 800
how works

Thanks for the reply. I have changed as per your suggestion. But that does not work. It appears as earlier (attached as screenshot). The code for dashboarBody is as below:

dashboardBody(
    tabsetPanel(
      tabPanel(title = "Summary Page-1",
               fluidRow(
                 column(6,plotlyOutput("plot1",height = 600,width = '100%')),
                 column(6,plotlyOutput("plot10",height = 600,width = '100%'))))
                 

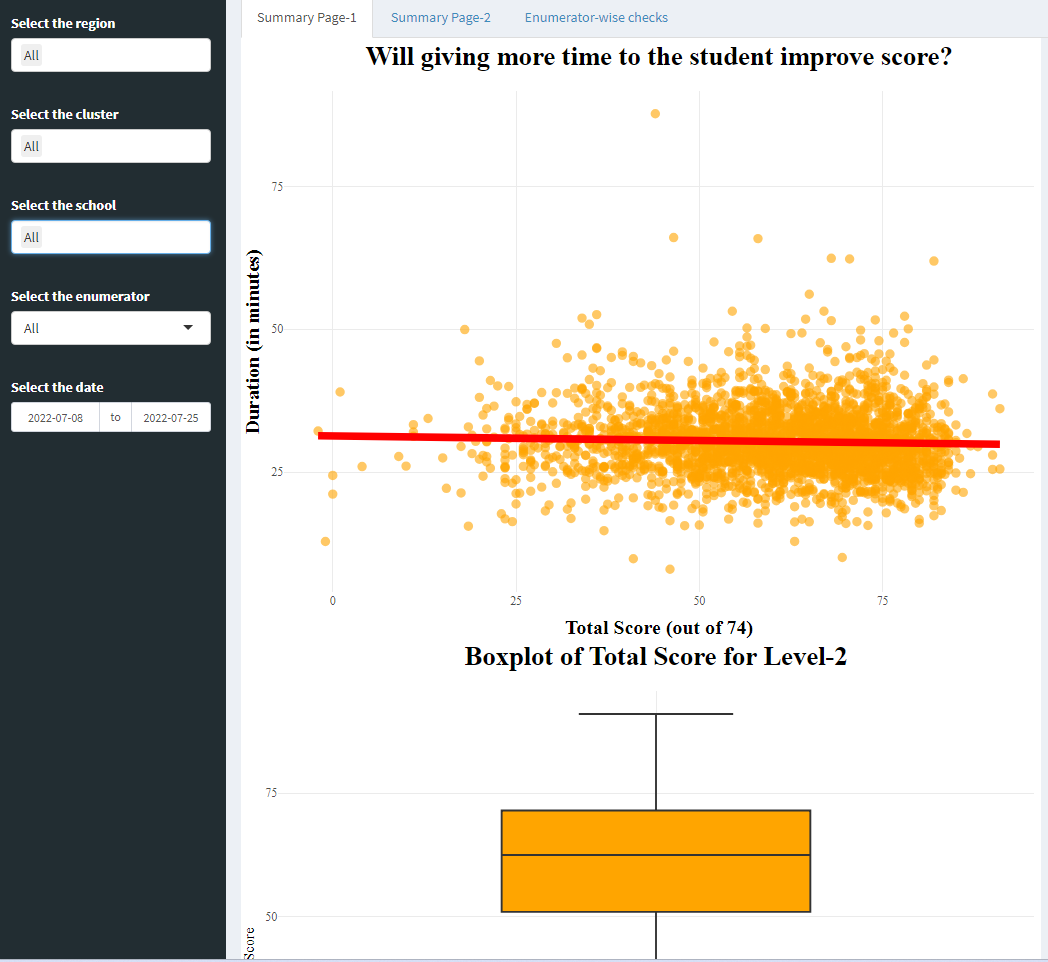
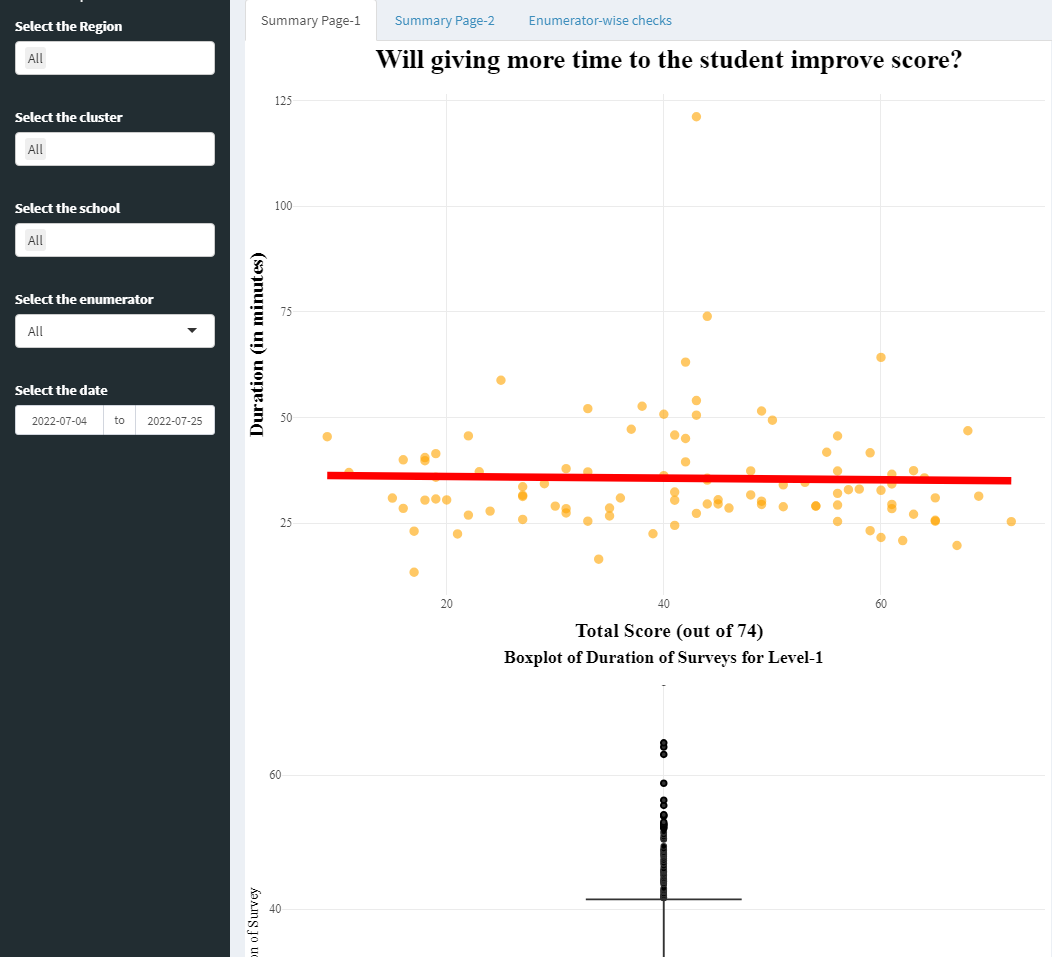
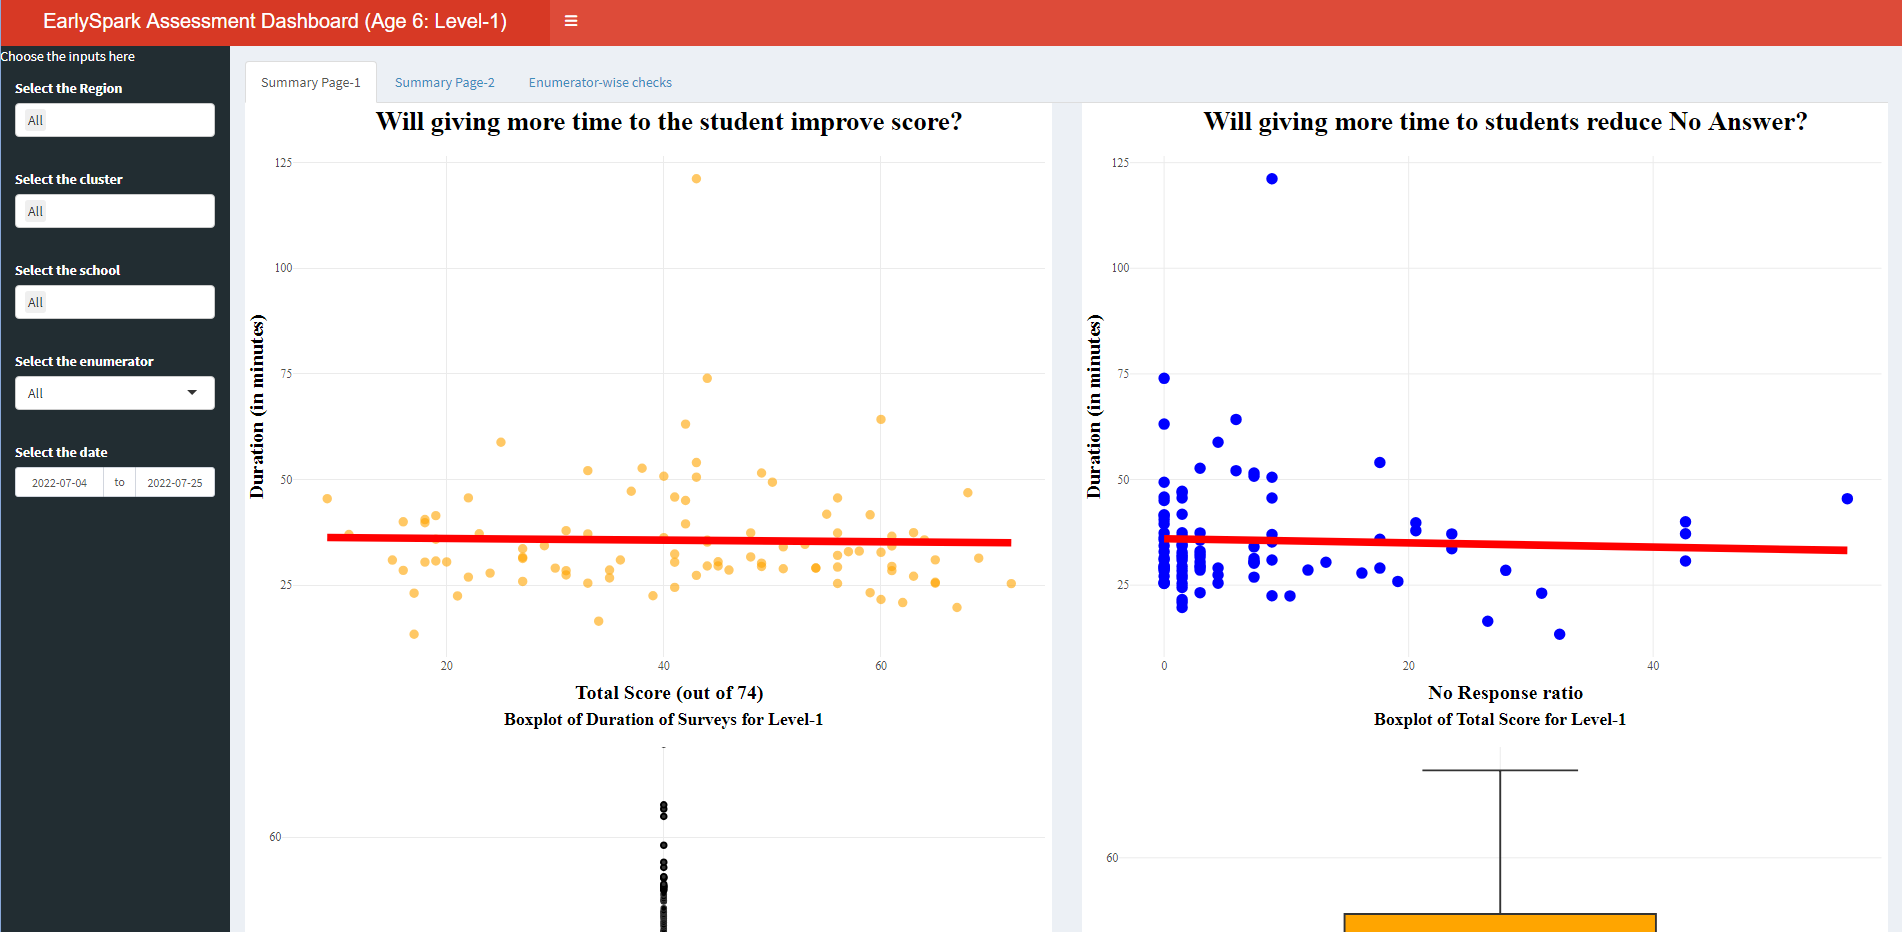
Hi, it works for me, please check this script. Hope helps

library(shiny)
library(shinydashboard)
library(plotly)
library(ggplot2)
library(dplyr)


header<- shinydashboardPlus::dashboardHeader(
  title = "Two Plots in one page",
  titleWidth = '500px'
)

sidebar <- dashboardSidebar(
  sidebarMenu(id = "tabs"
  ) #sidebar menu
)

  body <-dashboardBody(
    tabsetPanel(
      tabPanel(title = "Summary Page-1",
               fluidRow(
                 column(width = 6,plotlyOutput("plot1",height = 400,width = '100%')),
                 column(width = 6,plotlyOutput("plot10",height = 400,width = '100%')))
               ),
      tabPanel(title = "Summary Page-2",
               fluidRow(
                 column(width = 6,plotOutput("plot2",height = 400,width = '100%')),
                 column(width = 6,plotOutput("plot20",height = 400,width = '100%')))
      )
      )
)
  
  ui <- dashboardPage(
    header = header,
    sidebar = sidebar,
    body = body
  )

server <- function(input, output, session) {
  output$plot1 <- renderPlotly({
    fig <- plot_ly(mtcars, y = ~mpg, color = ~factor(cyl), type = "box")
    fig
  })
  
  output$plot10 <- renderPlotly({
    fig <- plot_ly(mtcars, y = ~mpg, color = ~factor(cyl), type = "bar")
    fig
  })
  
  output$plot2 <- renderPlot({
    hist(iris$Sepal.Length,
         main = NULL,
         labels = TRUE,
         col = "#87CEFA",
         border = "white",
         breaks = 10)+geom_point()+geom_smooth()+coord_cartesian()%>%
      abline(v = mean(iris$Sepal.Length, na.rm = T),
             col = "red",
             lwd = 2)%>%
      abline(v = median(iris$Sepal.Length, na.rm = T),
             col = "black",
             lwd = 2)
  })
  
  output$plot20 <- renderPlot({
    
    boxplot(x = iris$Sepal.Length,
            main = NULL,
            labels = TRUE,
            # col = "#87CEFA",
            # border = "black",
            col = "orange",
            border = "brown",
            notch = TRUE)
  })
  
  
}

shinyApp(ui, server)

Thank you very much for the response. I tried this, but it does not work. Is it because I am using ggplot and not base R plots?

Hi it is only a screen layout. does not get affected by ggplot or base plot. try and update packages in your laptop. go to toolsand update packages

should work
good luch
GP

Hi, sorry to get back to you so late. I have updated my packages. But that does not solve my problem.
I have used the code as below for dashboardBody. The screenshot of the dashboard is attached below.

dashboardBody(
    tabsetPanel(
      tabPanel(title = "Summary Page-1",
               fluidRow(
                 column(6,plotlyOutput("plot1",height = 600,width = '100%')),
                 column(6,plotlyOutput("plot2",height = 600,width = '100%')),
                 column(6,plotlyOutput("plot11",height = 600,width = '100%')),
                 column(6,plotlyOutput("plot10",height = 600,width = '100%'))))

Hi
Now you are getting two columns. I think your concern is second set of plots does not have space, it is coming together. in such case

   fluidRow(
             column(6,plotlyOutput("plot1",height = 600,width = '100%')),
             column(6,plotlyOutput("plot2",height = 600,width = '100%')),
             br(),
             column(6,plotlyOutput("plot11",height = 600,width = '100%')),
             column(6,plotlyOutput("plot10",height = 600,width = '100%'))))

Alternative approach
you can also use shinyjs. first add library
library(shinyjs)
in the place of br(), put this code, adjust px to get desired gap
div(style = "margin-top:10px"),
Hope helps

This topic was automatically closed 21 days after the last reply. New replies are no longer allowed.

If you have a query related to it or one of the replies, start a new topic and refer back with a link.