Graph with point gradient and ellipses in ggplot

Hello everyone,

As part of my study, I am trying to highlight the proportion of forest and grassland ground beetle communities present in woodland pastures which are a transition zone between the two previous habitats.

I first performed an NMDS. I then extracted the X and Y coordinates of the NMDS for 29 study sites representing ground beetle communities, in order to insert them into a ggplot. In these 29 sites, 4 are considered as forest, 6 as unwooded pasture and 19 as wooded pasture.
I also have a variable that shows the density of trees for each of the 29 study sites.
I try in vain to put in a ggplot both my 29 points with a colour gradient corresponding to my tree density variable and my three ellipses coloured by 3 different colours representing the 3 habitats (forest, unwooded pasture and wooded pasture)

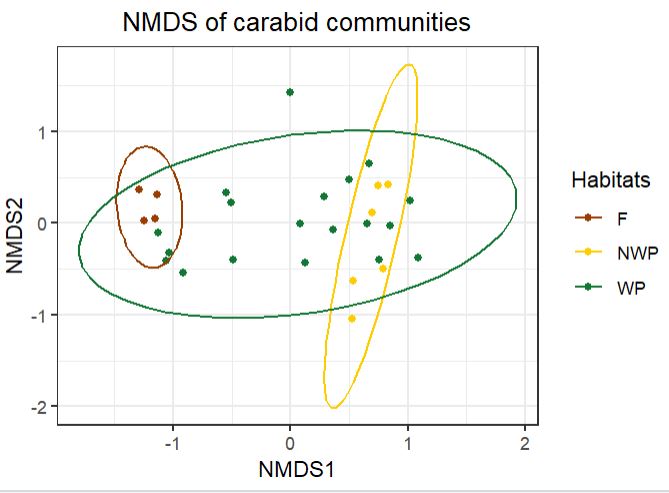
Here is the code that puts the 3 habitats with 3 different coloured ellipses (what I want). But the points represent the 3 habitats and not the woody density variable which could be represented by a colour gradient.

ggplot(dune.nmds.data, aes(x = dune.nmds.data$NMDS1, y = dune.nmds.data$NMDS2, color = Habitats)) + geom_point() + stat_ellipse()+theme_bw()+xlab("NMDS1")+ylab("NMDS2")+ggtitle("NMDS of carabid communities")+ theme(plot.title = element_text(hjust = 0.5))+ scale_color_manual(values=c("F"="#993D00", "WP"="#117733", "NWP"="#FFCC00"))

Capture

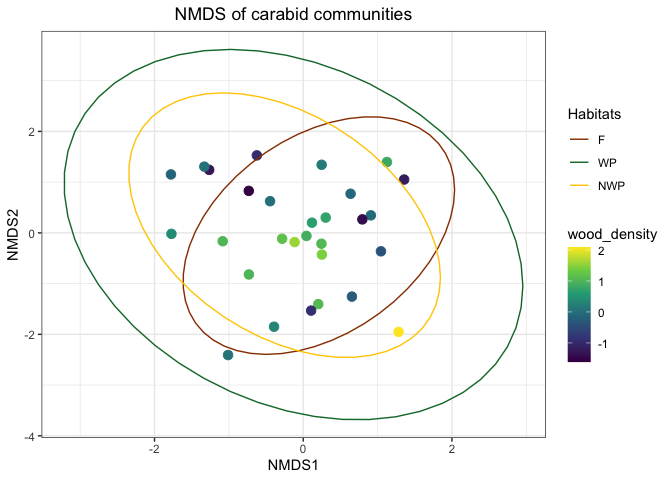
The second graph and code gives me this time the points with a colour gradient corresponding to the density of trees, but the ellipses do not represent the habitats with distinct colours and there is no label.
ggplot(dune.nmds.data, aes(dune.nmds.data$NMDS1, dune.nmds.data$NMDS2, color=wood_density, group = Habitats)) + geom_point(size=3) + stat_ellipse()

Furthermore, I try to insert my coloured gradient of tree density with my coloured ellipses representing my 3 habitats, but I get this error message: Error: Discrete value supplied to continuous scale.

Do you have an idea ?

I hope that I have been precise enough and I thank you in advance.
Best regards,
Erwan

Hi @ErwanZ ,

I simulated some fake data to reproduce your plots. I might be misunderstanding the question...but I think this is what you are trying to achieve. I even demonstrate how to use different scale_color_... for different geoms.

library(tidyverse)
library(ggnewscale)

dune.nmds.data <- 
  tibble(
    NMDS1 = rnorm(29),
    NMDS2 = rnorm(29),
    Habitats = sample(c('F', 'NWP', 'WP'), 29, TRUE),
    wood_density = rnorm(29)
  )

dune.nmds.data |> 
  ggplot(aes(x = NMDS1, y = NMDS2)) +
  geom_point(aes(color = wood_density), size = 3) + 
  scale_color_viridis_c() +
  new_scale_color() +
  stat_ellipse(aes(color = Habitats)) +
  scale_color_manual(values = c(F = "#993D00", WP = "#117733", NWP ="#FFCC00")) +
  ggtitle("NMDS of carabid communities") + 
  theme_bw() +
  theme(plot.title = element_text(hjust = 0.5))

3 Likes

Thank you very much for your help and your quick response, it works!
Really a good forum :grinning:

Thumbs up for the "new_scale_color()" - this was new to me!
However, I think this complicates the interpretation, as the presense in the habitats gets lost, not every point in the circle matches to the indicated habitat.
I would instead keep the colour and show the wood density by another parameter, e.g. the size (or the shape, or alpha).

dune.nmds.data <- 
  tibble(
    NMDS1 = c(rnorm(5, -1, 0.25),      # F
              rnorm(5, 1, 0.25),     # NWP
              rnorm(20, 0, 1)),     # WP
    NMDS2 = c(rnorm(5, 0.2, 0.25),       # F
              rnorm(5, 0, 0.5),       # NWP
              rnorm(20, 0, 0.25)),     # W
    Habitats = c(rep("F", 5), rep("NWP", 5), rep("WP", 20)),
    wood_density = rnorm(30)
  )

dune.nmds.data %>%  
  ggplot(aes(x = NMDS1, y = NMDS2,
             color = Habitats)) +
  geom_point(aes(size = wood_density),
             alpha = 0.5) + 
  stat_ellipse() +
  scale_color_manual(values = c(F = "#993D00", WP = "#117733", NWP ="#FFCC00")) +
  ggtitle("NMDS of carabid communities") + 
  theme_bw() +
  theme(plot.title = element_text(hjust = 0.5))

dune.nmds.data %>%  
  ggplot(aes(x = NMDS1, y = NMDS2,
             color = Habitats)) +
  geom_point(aes(alpha = wood_density),
             size = 4) + 
  stat_ellipse() +
  scale_color_manual(values = c(F = "#993D00", WP = "#117733", NWP ="#FFCC00")) +
  ggtitle("NMDS of carabid communities") + 
  theme_bw() +
  theme(plot.title = element_text(hjust = 0.5))

Indeed, I had not seen it that way. It is sometimes quite subjective to categorise habitats, i.e. when is a heavily wooded pasture considered to be a forest? But in any case, thank you for your addition, I will talk to my teacher about it. :smiley:
Have a nice evening!

This topic was automatically closed 7 days after the last reply. New replies are no longer allowed.

If you have a query related to it or one of the replies, start a new topic and refer back with a link.