Has anyone found a workaround for the bug in ggplotly where negative values aren't displayed?

ggplotly has a bug where negative values are incorrectly displayed as positive in the tooltip (a known and unresolved issue).

library(ggplot2)
library(plotly)

mydf <- data.frame("drug"=c("A", "B", "C"),
                   "response"=c(1,5,-5))

p <- ggplot(mydf, aes(x=drug, y=response))+
  geom_bar(stat="identity")

ggplotly(p)

plotly_bug

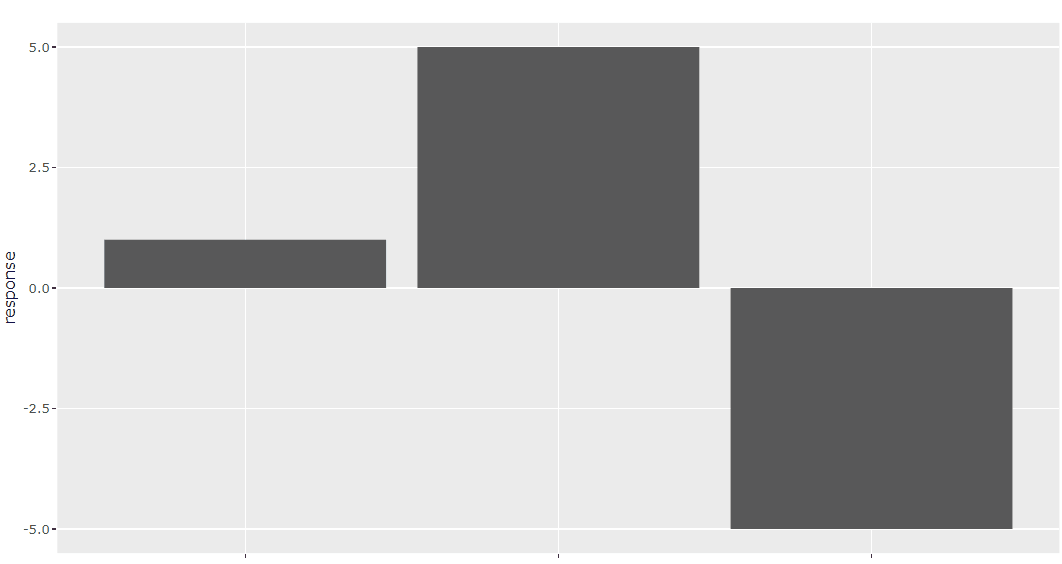
Since the issue is a few years old I'm wondering if anyone has found a fix? Strangely, negative values are correctly displayed in the tooltip for geom_point, but not geom_bar...

1 Like

switch to

+
geom_col()
4 Likes

@nirgrahamuk wow! I don't know how you are so quick to always solve problems here, I spent 2 days googling around and perusing GitHub issues, and still couldn't get it. Solved! thanks!

This topic was automatically closed 7 days after the last reply. New replies are no longer allowed.

If you have a query related to it or one of the replies, start a new topic and refer back with a link.