Hi Willaiml unfortunately did not work.
How can I share my database to you ?
This is my entire code if I run just one regression I can get all the stats for the model.
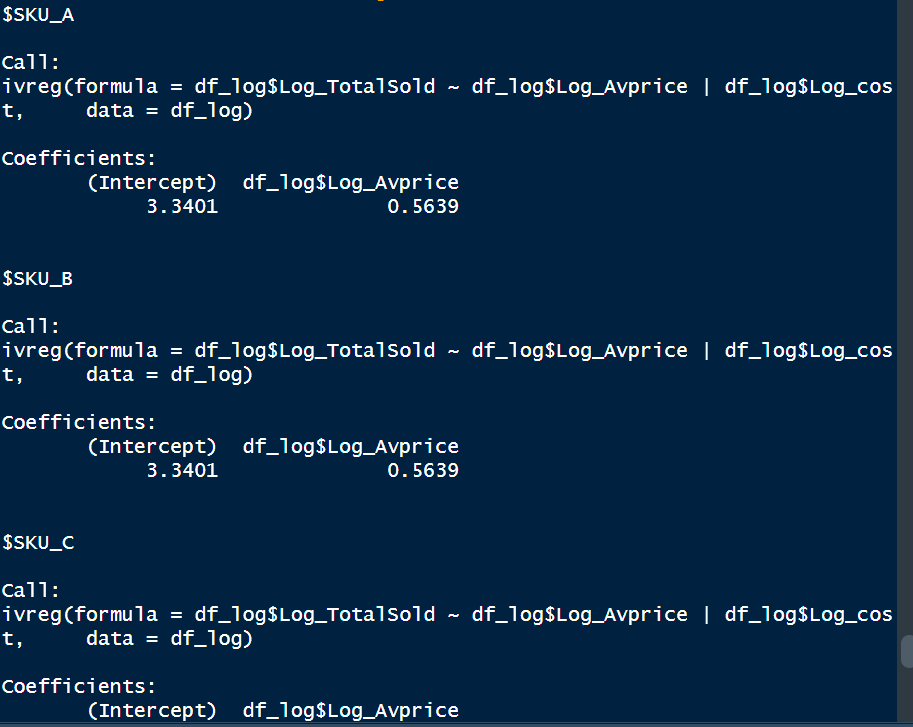
However I need to run the ivreg based on product not one for all the different products.
pacotes <- c("kableExtra","reshape2","tidyverse","ggsci","gridExtra","lubridate",
"data.table","estimater","modelsummary","broom","lmtest","OIdata","sandwich","doBy","openintro","ivpack","arm","stargazer","jtools","plm","car","caret","carData","dplyr","AER")
Install all the needed packages to deploy the model
if(sum(as.numeric(!pacotes %in% installed.packages()))!= 0){
instalador <- pacotes[!pacotes %in% installed.packages()]
for (i in 1: length(instalador)) {
install.packages(instalador,dependencies = T)
break()}
sapply(pacotes, require, character = T)
} else {
sapply(pacotes,require,character = T)
}
Bringing the csv to R
dados <- read.csv("C:\Users\thale\Desktop\20231101_Elasticity.csv",
sep = ";")
str(dados) ## Verify the structure of the dataset
View(head(dados)) ## Check all the basket based on the dataset
Working on some cleaning
dados2 <- dados[,!names(dados) %in% c("X", "X.1")]
dados2 <- dados2 %>%
mutate(SalesDate = as.Date(SalesDate, "%d/%m/%Y"))
str(dados2)
dim(dados2)
Remove NAS from the dataset
dados2 <- dados2 %>% drop_na()
df_log <- df_log %>% drop_na()
Create log data.frame
df_log <- data.frame(Sales_date=dados2$SalesDate,
Sku=dados2$Sku,
Log_Revenue=log(dados2$Revenue),
Log_TotalSold=log(dados2$TotalSold),
Log_Avprice=log(dados2$AvPrice),
Log_inflation=log(dados2$Inflation),
Log_cost=log(dados2$Cost)
)
Pricing variance
pricevar <- ggplot(dados2,aes(x = SalesDate, y = AvPrice, group = Sku)) +
geom_line(aes(color = Sku)) +
theme_minimal() +
ylim(0,320) +
scale_x_date(date_breaks = "2 months") +
labs(title = "Price Variance over time")
pricevar
Price data exploration 2
df_pricestr = dados2 %>%
group_by(Sku) %>%
summarise(min_price = min(AvPrice),
mean_price = mean(AvPrice),
max_price = max(AvPrice))
df_pricestr_l = melt(df_pricestr, id = 'Sku')
Data visuals for min, max, av price.
p_price_arch = ggplot(df_pricestr_l, aes(x = Sku, y = value, group = variable)) +
geom_point(aes(color = variable), size = 4, shape = 20) +
theme_minimal() +
theme(axis.text.x = element_text(size = 10),
axis.text.y = element_text(size = 10),
legend.text = element_text(size = 10)) +
scale_color_npg(breaks=c("max_price","mean_price","min_price")) +
labs(title = 'Price Architecture',
x = "",
y = 'Price Structure') +
geom_text(aes(label=round(value, 2)),hjust=-0.3, vjust=-1)
p_price_arch
Running IV try to resolve the issues for endogeinity
Principais razoes sao vies de variavel omitida e simultanedade
Com endogeneidade no modelo os Betas acabam nao sendo bons estimadores
Simultaneidade ( y = a + b1 * x + uerro) - Y impacta X o que na verdade deveria ser o X e o termo de erro U impactando Y
vies variavel omitida ( y = a + b1 * x + u) - Termo de erro(variavel omitida no termo) impacta nosso X sendo assim no B1 nao estara capturando apenas o impacto de x em y e sim o valor do termo de erro tambem
Y = outcome variable (log quantity)
X = Endogenous variable (Log price)
Z = Instruments (Inflation, Cost)
W = Any exogenous variables not including in the instrument
List
sku_list = unique(df_log$Sku)
sku_list
IV Equation
ivreg(Y ~ X + W | W + Z)
Run the model for each SKU in data frame
regressions <-c()
for(i in sku_list){
regressions[i] <- ivreg(df_log[df_log$Sku==i,]$Log_TotalSold ~
df_log[df_log$Sku==i,]$Log_Avprice |
df_log[df_log$Sku==i,]$Log_cost,data = df_log)
}
Getting the list of coefficients
m_list <- list(IV = regressions)
m_list