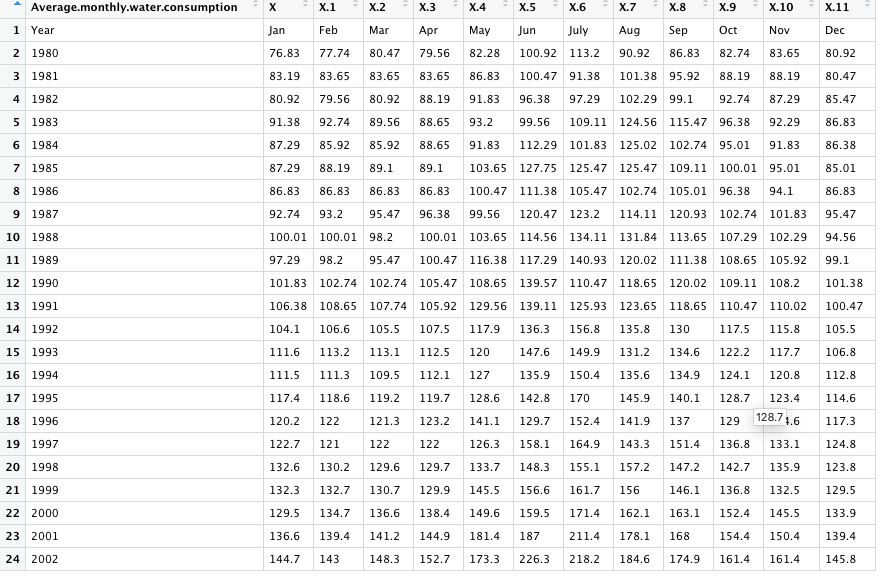
The data I am importing is year water consumption organized into a mean value for each month. How do I plot this data? I attached a picture of the way the data looks now to show what I mean here. Any help wrangling this data would be great.
It depends pretty much on the question you are trying to answer.
If you are asking about the actual mechanics of plotting something in R you might want to look at the sources mentioned in New to learning R - #4 by Flm
BTW, the screen shot was fine here but for most questions it is better to supply usable data. A handy way to supply some sample data is the dput() function. In the case of a large dataset something like dput(head(mydata, 100)) should supply the data we need.
See FAQ: How to do a minimal reproducible example ( reprex ) for beginners for more details.
Well I'm trying to plot the consumption data as a time series, but the usual plot functions do not accurately plot what I'm trying to see. I want to see consumption over the years, so I need to somehow organize the monthly means so it corresponds with the respective year.
You need to do three things:
- Read the data in so that your header row is not treated as data. In the image, row 1 is the headers. If the function you are using to read the data has a skip argument, setting that to 1 might fix the problem.
- Reshape the data to a long format so that your month labels are in one column and the values in one other column.
- Make dates by combining the year and month information.
Here is an example of doing that with toy data.
library(dplyr)
library(tidyr)
library(lubridate)
library(ggplot2)
DF <- data.frame(Year = c(1990,1991), Jan = c(78, 76),
                 Feb = c(69,72), Mar = c(81,76))
DF
#>   Year Jan Feb Mar
#> 1 1990  78  69  81
#> 2 1991  76  72  76

DFlong <- pivot_longer(DF, cols = -Year, names_to = "Month",
                       values_to = "Value")
DFlong
#> # A tibble: 6 × 3
#>    Year Month Value
#>   <dbl> <chr> <dbl>
#> 1  1990 Jan      78
#> 2  1990 Feb      69
#> 3  1990 Mar      81
#> 4  1991 Jan      76
#> 5  1991 Feb      72
#> 6  1991 Mar      76
DFlong <- mutate(DFlong, Date = ymd(paste(Year, Month, "01", sep = "-")))
DFlong
#> # A tibble: 6 × 4
#>    Year Month Value Date
#>   <dbl> <chr> <dbl> <date>
#> 1  1990 Jan      78 1990-01-01
#> 2  1990 Feb      69 1990-02-01
#> 3  1990 Mar      81 1990-03-01
#> 4  1991 Jan      76 1991-01-01
#> 5  1991 Feb      72 1991-02-01
#> 6  1991 Mar      76 1991-03-01
ggplot(DFlong, aes(Date, Value)) + geom_point()
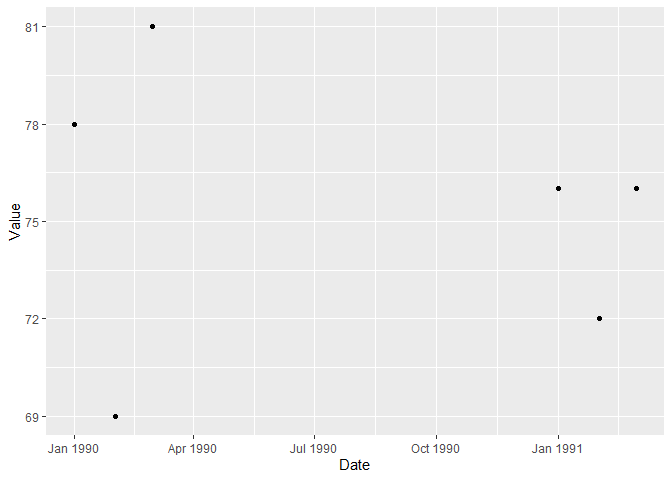
Created on 2022-12-02 with reprex v2.0.2
For all things time-series related, the {fpp3} package and associated text will provide all the tools you need.
This topic was automatically closed 21 days after the last reply. New replies are no longer allowed.
If you have a query related to it or one of the replies, start a new topic and refer back with a link.