Help with plot.design

Colleagues, good afternoon!
Very much in need of your help! I work with the value of acidity in the soil depending on the depth of sampling and soil damage. I need to build a plot.design with a custom scale, but all attempts fail.
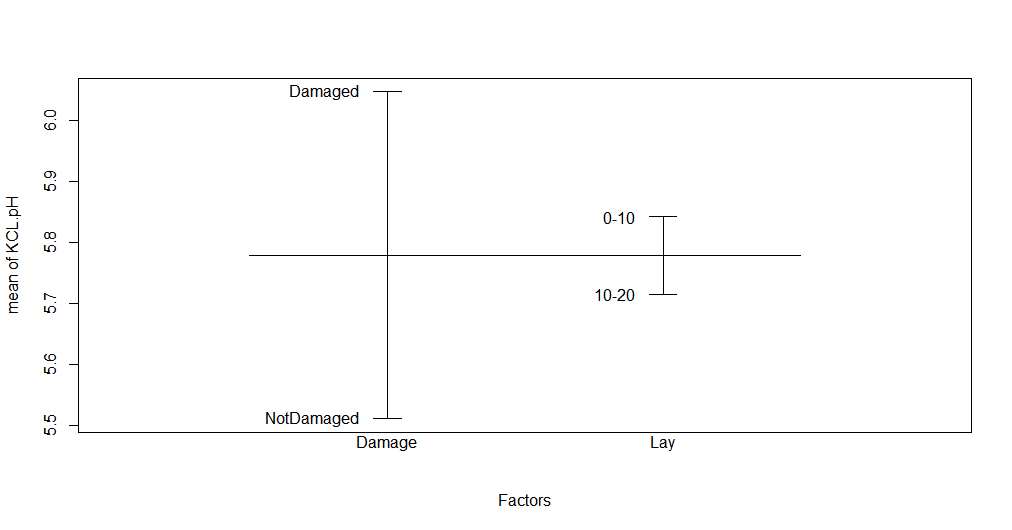
Here is the code and the picture I get as a result. But I wanted to add y-values that are less than 5.5 and greater than 6.0 to it. Can you tell me how to do this?

  Damage   Lay KCL.pH

1 Damaged 0-10 5.66
2 Damaged 10-20 5.15
3 NotDamaged 0-10 5.03
4 NotDamaged 10-20 5.79
5 Damaged 0-10 6.37
6 Damaged 10-20 6.09
7 NotDamaged 0-10 5.55
8 NotDamaged 10-20 5.51
9 Damaged 0-10 6.86
10 Damaged 10-20 6.15
11 NotDamaged 0-10 5.58
12 NotDamaged 10-20 5.60

setwd("C:/Users/User/Desktop")
Data <- read.table(file = "1.csv", header = TRUE, sep = ",")
Data$Damage = factor(Data$Damage,
levels=unique(Data$Damage))

Data$Lay = factor(Data$Lay,
levels=unique(Data$Lay))
plot.design(Data)

This can also be done in {ggplot2} with much more control over layout and annotation.

Data <- read.table(file = "/home/roc/Desktop/sketch", header = TRUE, sep = ",")
Data$Damage <- factor(Data$Damage,
  levels = unique(Data$Damage)
)

Data$Lay <- factor(Data$Lay,
  levels = unique(Data$Lay)
)
plot.design(Data)
abline(5.5,0)
abline(6,0)

Data <- read.table(file = "/home/roc/Desktop/sketch", header = TRUE, sep = ",")
Data$Damage <- factor(Data$Damage,
  levels = unique(Data$Damage)
)

Data$Lay <- factor(Data$Lay,
  levels = unique(Data$Lay)
)
plot.design(Data)
abline(5.5,0)
abline(6,0)

1 Like

More thanks for the reply!
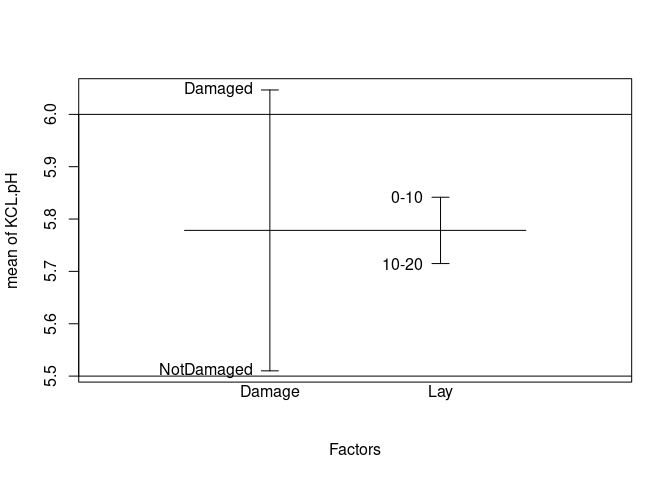
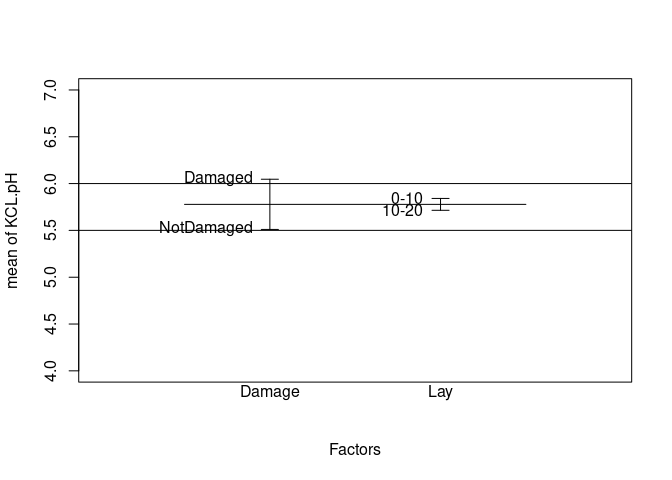
Very much appreciated what you showed me how to do, but I was looking for a little different. I was looking to change the scale so that the graph shows smaller and larger pH values, lengthen the y-axis. Is it possible to do that?

You can set the ylim, but there are trade-offs

Data <- read.table(file = "/home/roc/Desktop/sketch", header = TRUE, sep = ",")
Data$Damage <- factor(Data$Damage,
                      levels = unique(Data$Damage)
)

Data$Lay <- factor(Data$Lay,
                   levels = unique(Data$Lay)
)
plot.design(Data, ylim = c(4,7))
abline(5.5,0)
abline(6,0)

This topic was automatically closed 7 days after the last reply. New replies are no longer allowed.

If you have a query related to it or one of the replies, start a new topic and refer back with a link.