Help with R Markdown. How to create a « nice » table of result?

Hello,

I am a long-time user of R, but I basically always do the same thing… Generate an « ugly » table of descriptive statistics with summaryBy and doing ANOVA, post-hoc tests, etc.

I recently discover R Markdown and got really existed with its great potential to create nice statistical reports and more.

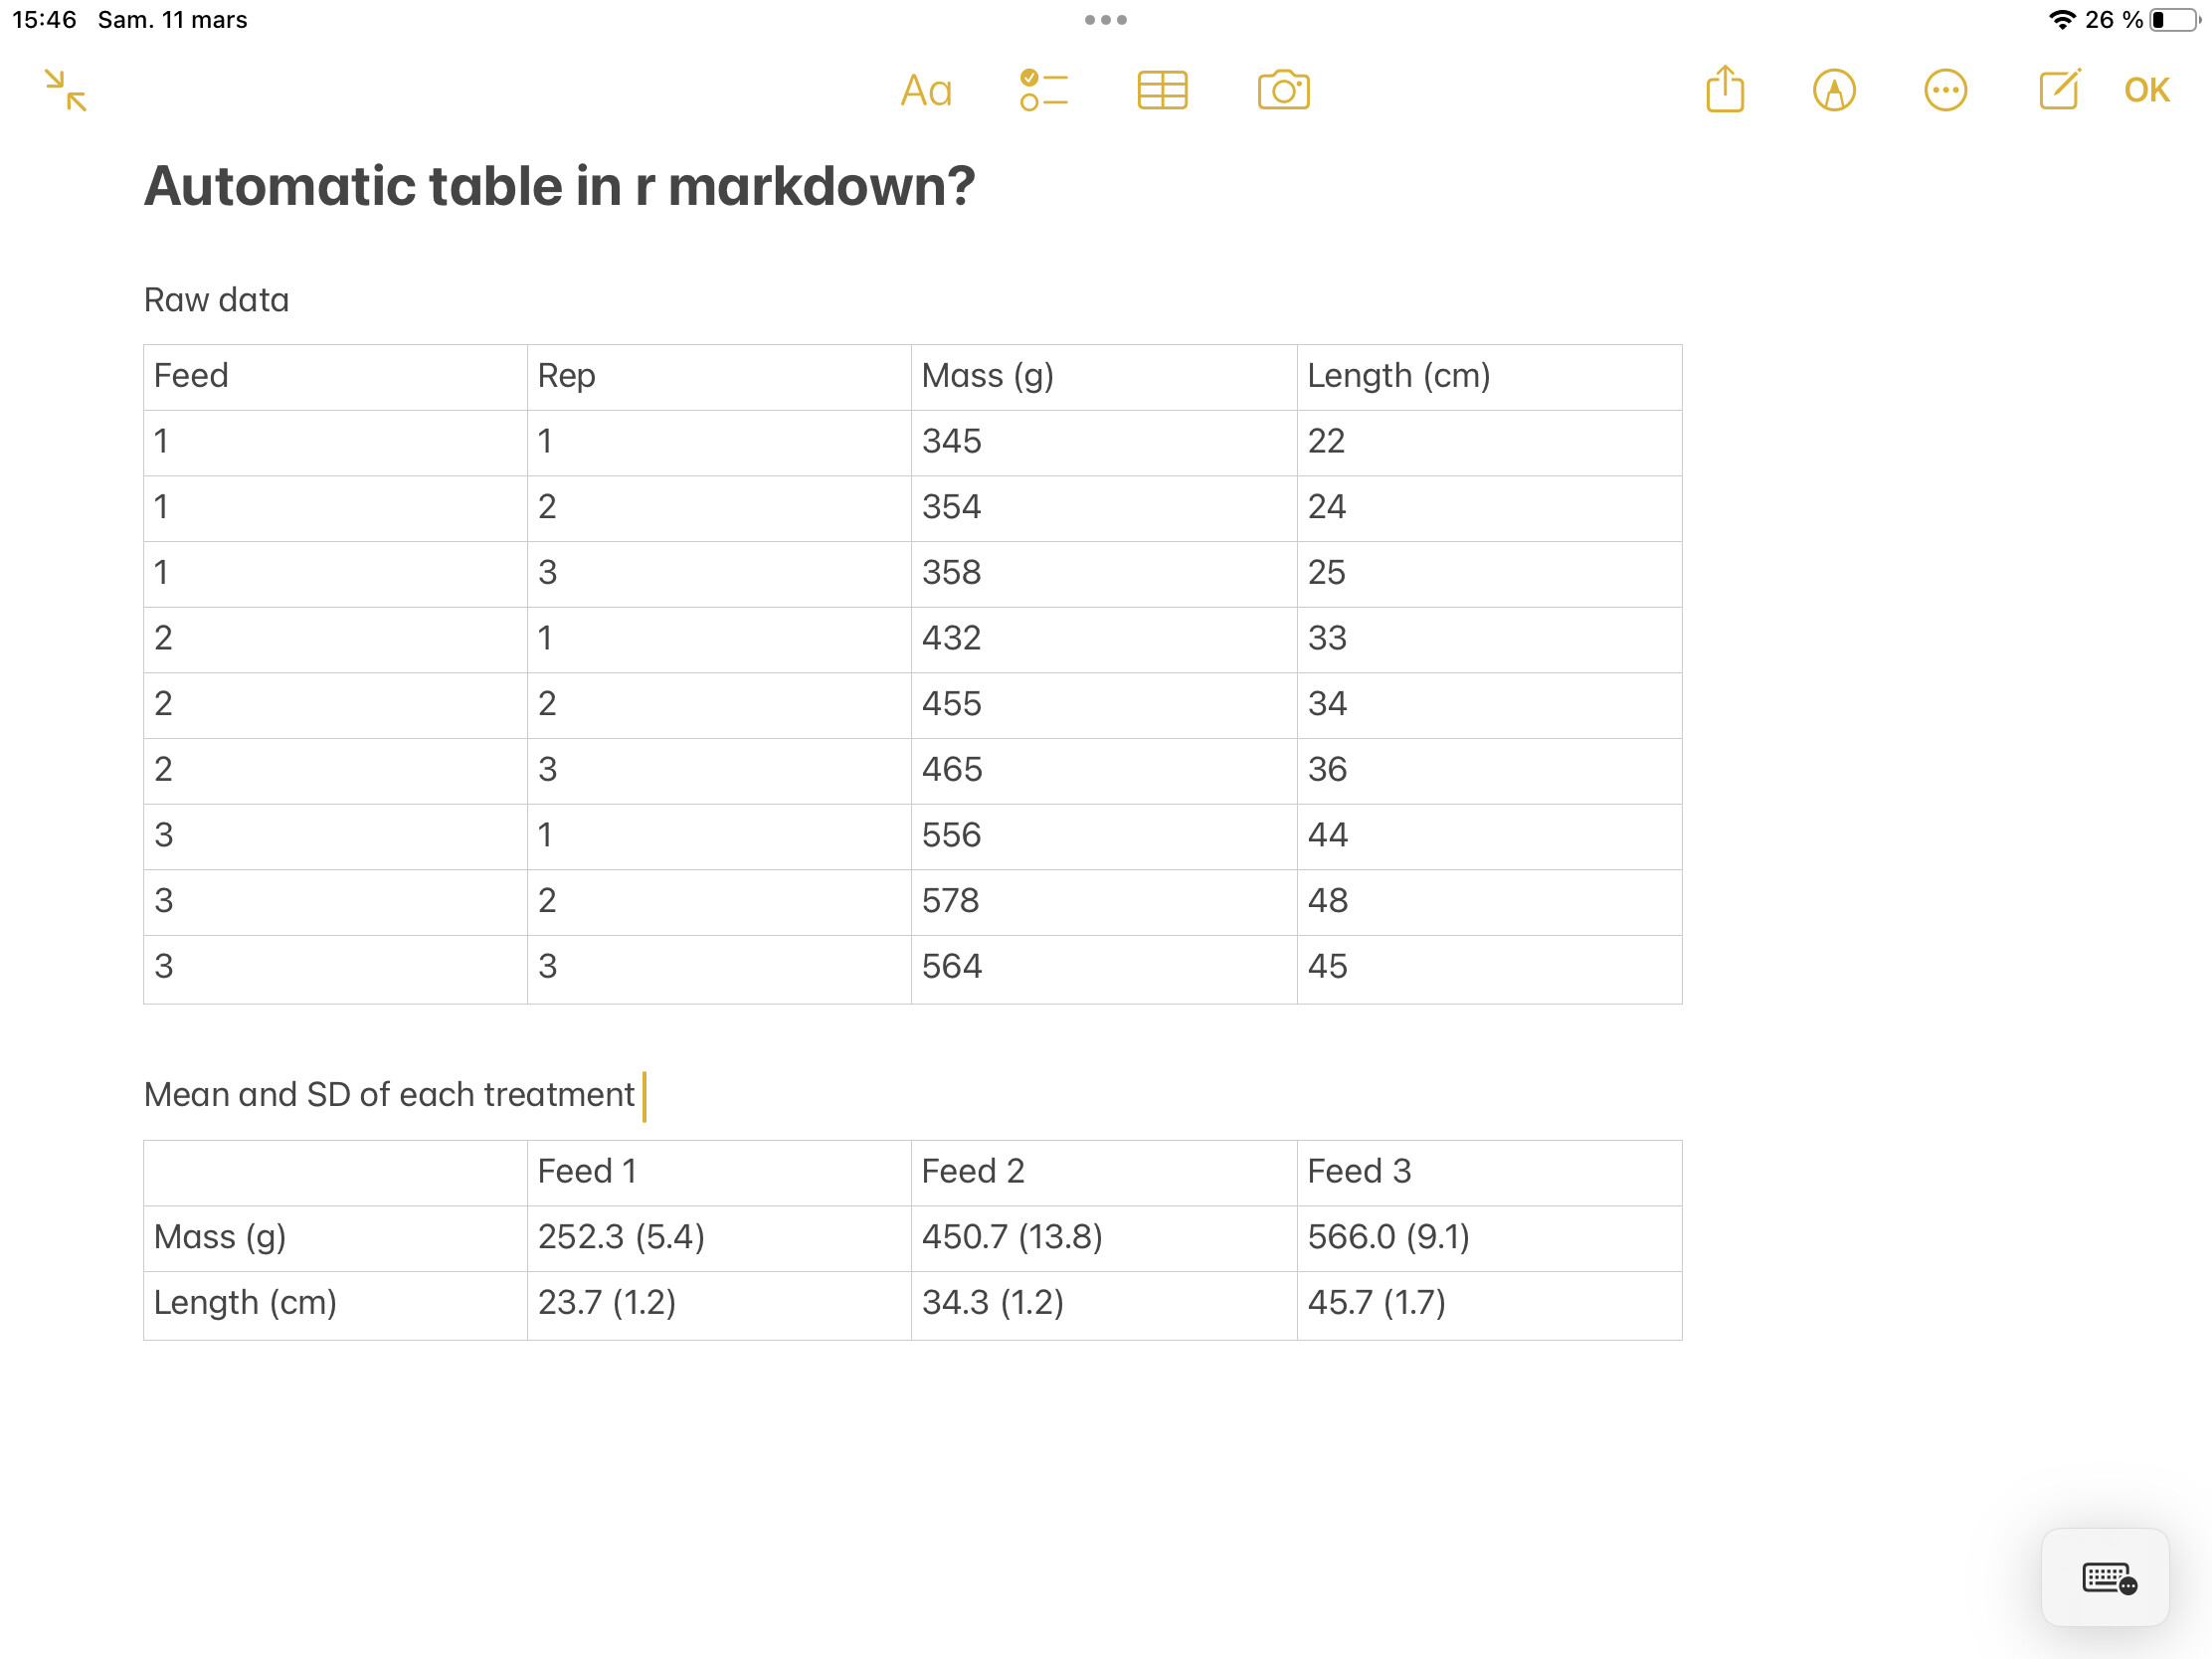
I have attached a screenshot of a simplified kind of raw data I usually produce in my research and the type of table I eventually publish.

I search the web for R code to produce the second table on my screenshot, but I did not find exactly what I was looking for.

Does someone is the Research Gate could help me?

Thanks in advance!

You are probably spoiled for choice.

Top 7 Packages for Making Beautiful Tables in R, sumtable: Summary Statistics, gtsummary. There are other more specialized packages depending on needs. firstable or APA Tables

We also show some table packages and mentions other in the R Markdown Cookbook

This topic was automatically closed 45 days after the last reply. New replies are no longer allowed.

If you have a query related to it or one of the replies, start a new topic and refer back with a link.