library(ggplot2)
ggplot(voting, # Change colors and shapes of points by group
aes(x = PERIOD,
y = Subject,
group = Vote)) +
geom_point(aes(color = Vote, shape = Vote))
library(ggplot2)
ggplot(voting, # Change colors and shapes of points by group
aes(x = PERIOD,
y = Subject,
group = Vote)) +
geom_point(aes(color = Vote, shape = Vote))
I'm confused whether you have an issue requiring support or not ?
'seems too easy' is not traditionally a problem.
Yes, I need. The code I've used does not fit well.
What does it mean to not fit well ?
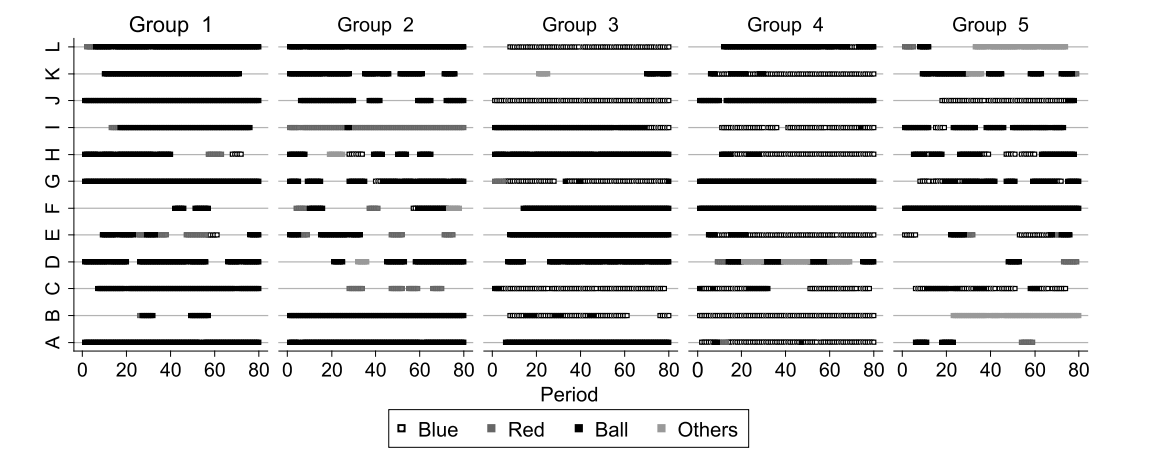
It is only able to replicate one group a time and not all five together
use facet_wrap or face_grid over whatever variable defines the groups
This topic was automatically closed 21 days after the last reply. New replies are no longer allowed.
If you have a query related to it or one of the replies, start a new topic and refer back with a link.