Hello,
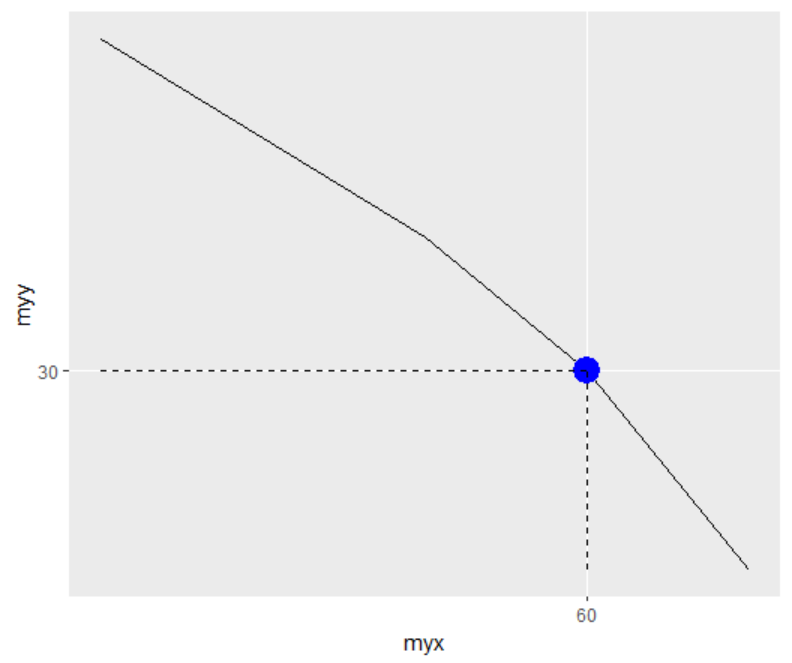
I want to highlight points on a graph with ggplot2. I just need the coordinates to clearly appear on the x and y axis just like this :
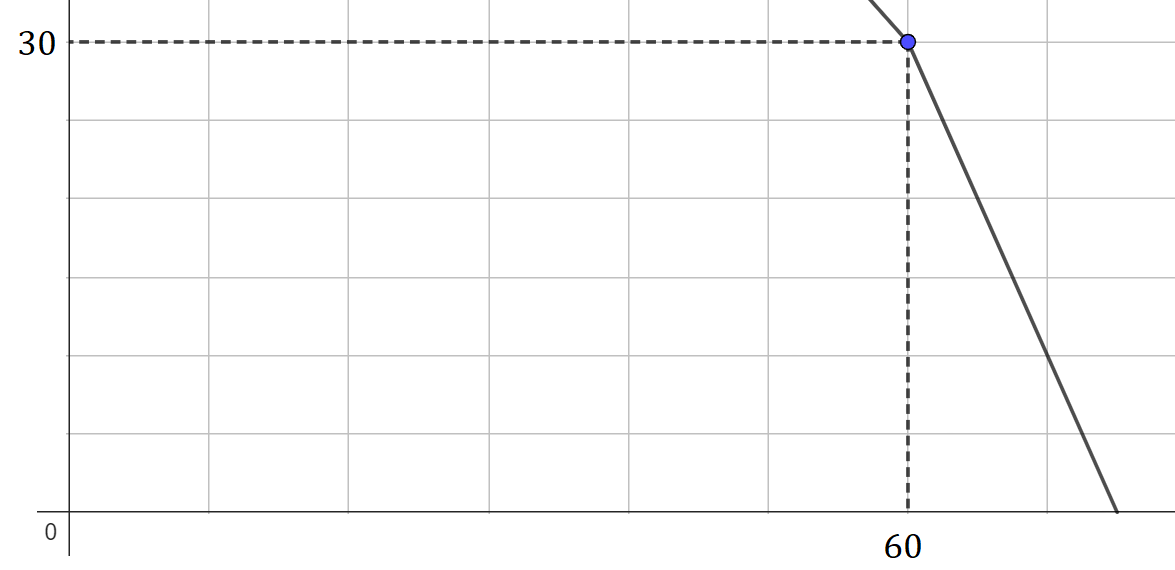
What code/function can do that ?
Thanks.
Hello,
I want to highlight points on a graph with ggplot2. I just need the coordinates to clearly appear on the x and y axis just like this :
What code/function can do that ?
Thanks.
library(tidyverse)

myd <- data.frame(myx=c(0,40,60,80),
                  myy=c(80,50,30,0))

ggplot(data=myd)+
  aes(x=myx,
      y=myy) +
  geom_line()+
  geom_point(aes(x=60,
                 y=30),color="blue",size=6)+
  geom_line(data=data.frame(myx=rep(60,2),
                            myy=c(0,30)),linetype="dashed") +
  geom_line(data=data.frame(myx=c(0,60),
                            myy=rep(30,2)),linetype="dashed") +
  scale_x_continuous(breaks=c(60))+
  scale_y_continuous(breaks=c(30))
Ok, thanks. So, now I have trouble trying to implement that on a more complicated graph.
I have two series y1_sum and y2_sum to plot according to x. Here is my code.
DF=data.frame(x,y1_sum,y2_sum)
DF %>% gather(key,value,y1_sum,y2_sum) %>%
ggplot(aes(x=x, y=value, colour=key, linetype=key)) +
geom_line()+scale_linetype_manual(values=c("solid", "twodash"))+ geom_line(data=data.frame(x=c(30,30),y=c(0.5,0)),linetype="dashed")
geom_line(data=data.frame(x=c(30,0),y=c(0.5,0.5)),linetype="dashed") +
geom_line(data=data.frame(x=c(38,38),y=c(0.5,0)),linetype="dashed") +
scale_x_continuous(breaks=c(30,38))+
scale_y_continuous(breaks=c(0.5))
I get an error with the geom_line commands. What is wrong ? I think it is the name of x and y that causes the problem.
Thank you again.
Thanks for providing code. Could you kindly take further steps to make it easier for other forum users to help you? Share some representative data that will enable your code to run and show the problematic behaviour.
You might use tools such as the library datapasta, or the base function dput() to share a portion of data in code form, i.e. that can be copied from forum and pasted to R session.
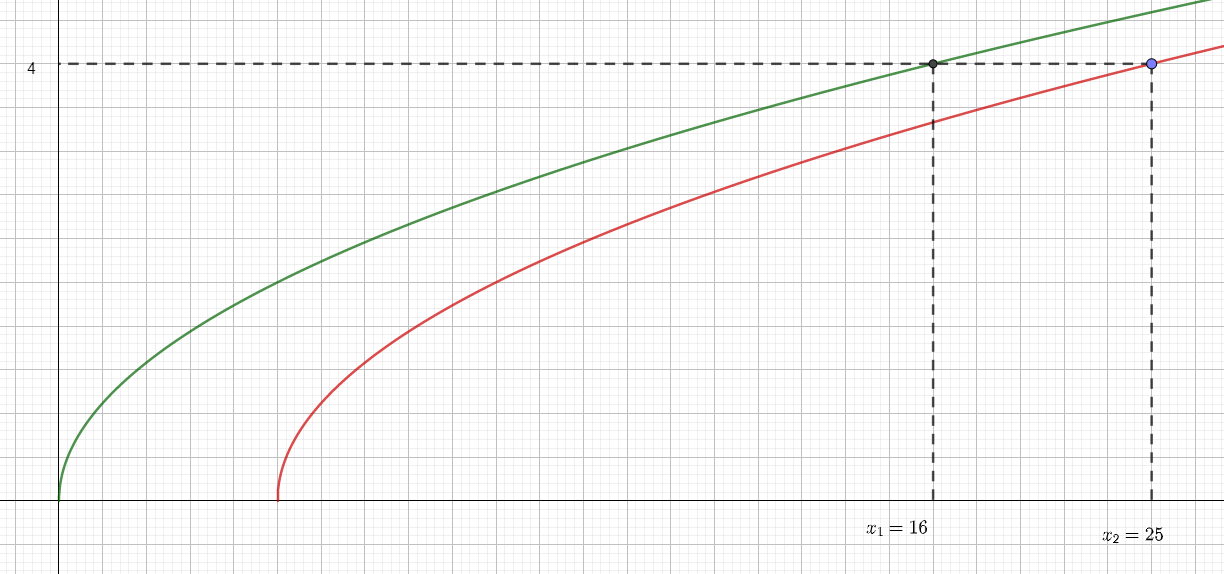
Ok, so let's say I want this graph. I have the curves y=sqrt(x) and y=sqrt(x-1) and I want to hightlight points (16,4) and (25,4). Which code could provide this exact graph with the labels on the x axis ? That would be perfect.
Thank you.
library(tidyverse)
(myd <- data.frame(x=seq(from=0,to=20,by=.02)) |> mutate(
y1=sqrt(x),
y2=sqrt(x-1)
))
myd_long <- pivot_longer(myd,cols=-x)
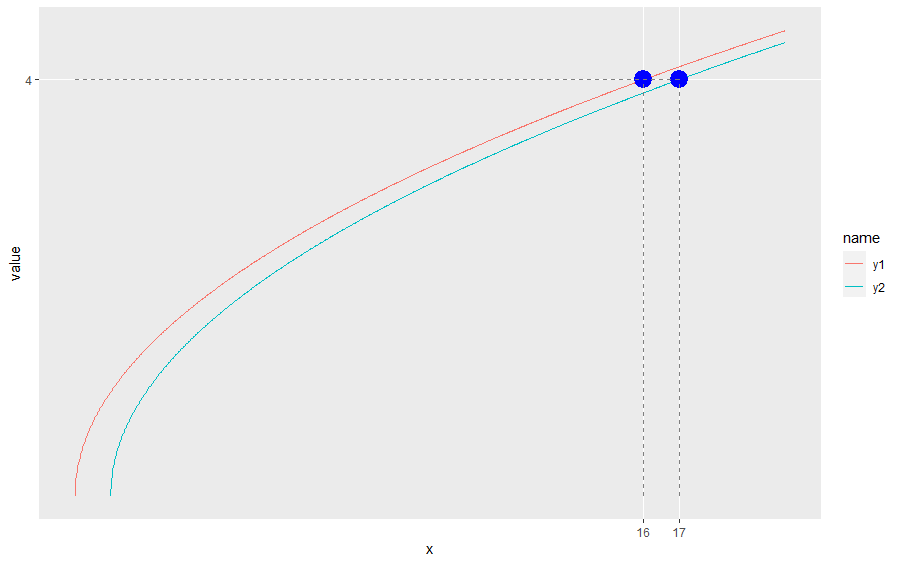
ggplot(data=myd_long)+
aes(x=x,
y=value,
color=name) +
geom_line()+
geom_point(data = data.frame(x=c(16,17),
value=c(4,4),
name=c(NA,NA)),color="blue",size=6)+
geom_line(data=data.frame(x=rep(16,2),
value=c(0,4),
name=rep(NA,2)
),linetype="dashed") +
geom_line(data=data.frame(x=rep(17,2),
value=c(0,4),
name=rep(NA,2)
),linetype="dashed") +
geom_line(data=data.frame(x=c(0,17),
value=c(4,4),
name=rep(NA,2) ),linetype="dashed") +
scale_x_continuous(breaks=c(16,17),
minor_breaks = NULL)+
scale_y_continuous(breaks=c(4),
minor_breaks = NULL)
Okay. I see I missed the option "name=c(NA,NA)" which is compulsory. Anyway, my code runs just fine now, so thanks again to you @nirgrahamuk. Have a good day !
This topic was automatically closed 7 days after the last reply. New replies are no longer allowed.
If you have a query related to it or one of the replies, start a new topic and refer back with a link.