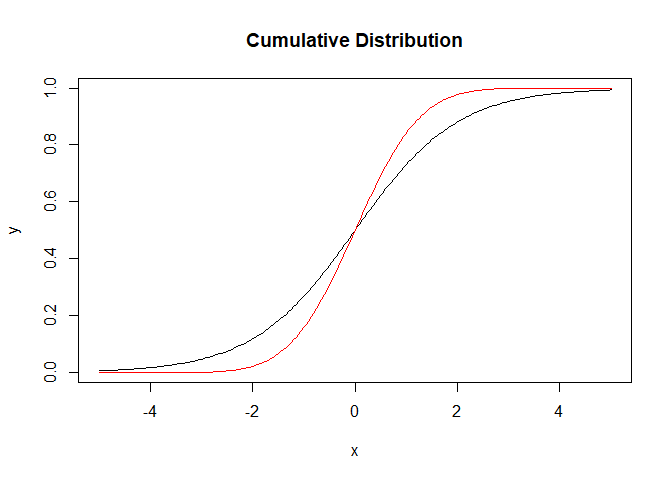
I want to merge these, but with different colors, so I can compare two graphs' formation. I guess I can solve this with ggplot2 package, but don't have any idea to go further. I would be appreciate if you tell me a solution.
ahh...I thought I have to use some connection like + or something like that...but it wasn't.
this is just an overlapping. Thank you. This is what I exactly wanted