How can I format the legend in a gtable plot object?

I am using the cutpointr package to generate cut off for a continuous variable. I work as prescribed but the plot objects generated are complex and a result of large gtable data. I want to format or edit the legend in the plot but I have failed totally with ggplot2

This is the code with cutpointr used to generate the cut off:

opt_cut_b_cycle.type<- cutpointr(hcgdf_v2, beta.hcg, livebirth.factor, cycle.type,
                             method = maximize_boot_metric, 
                             metric = youden, boot_runs = 1000, 
                             boot_stratify = TRUE, 
                             na.rm = TRUE) %>% add_metric(list(ppv, npv, odds_ratio, risk_ratio, p_chisquared))

plot(opt_cut_b_cycle.type)

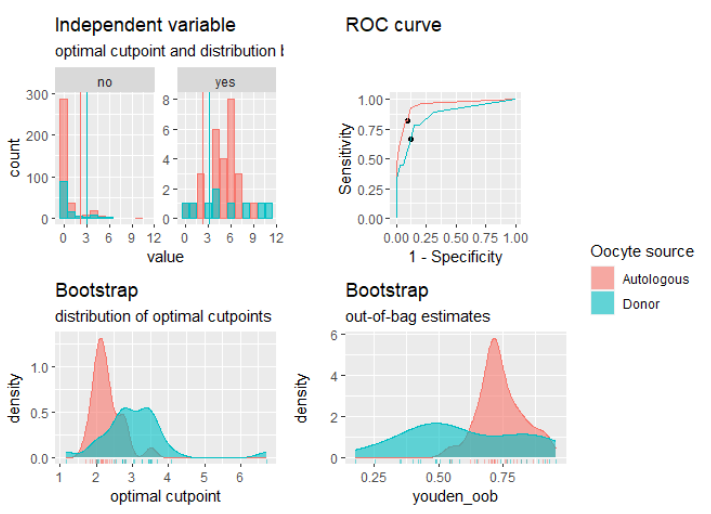
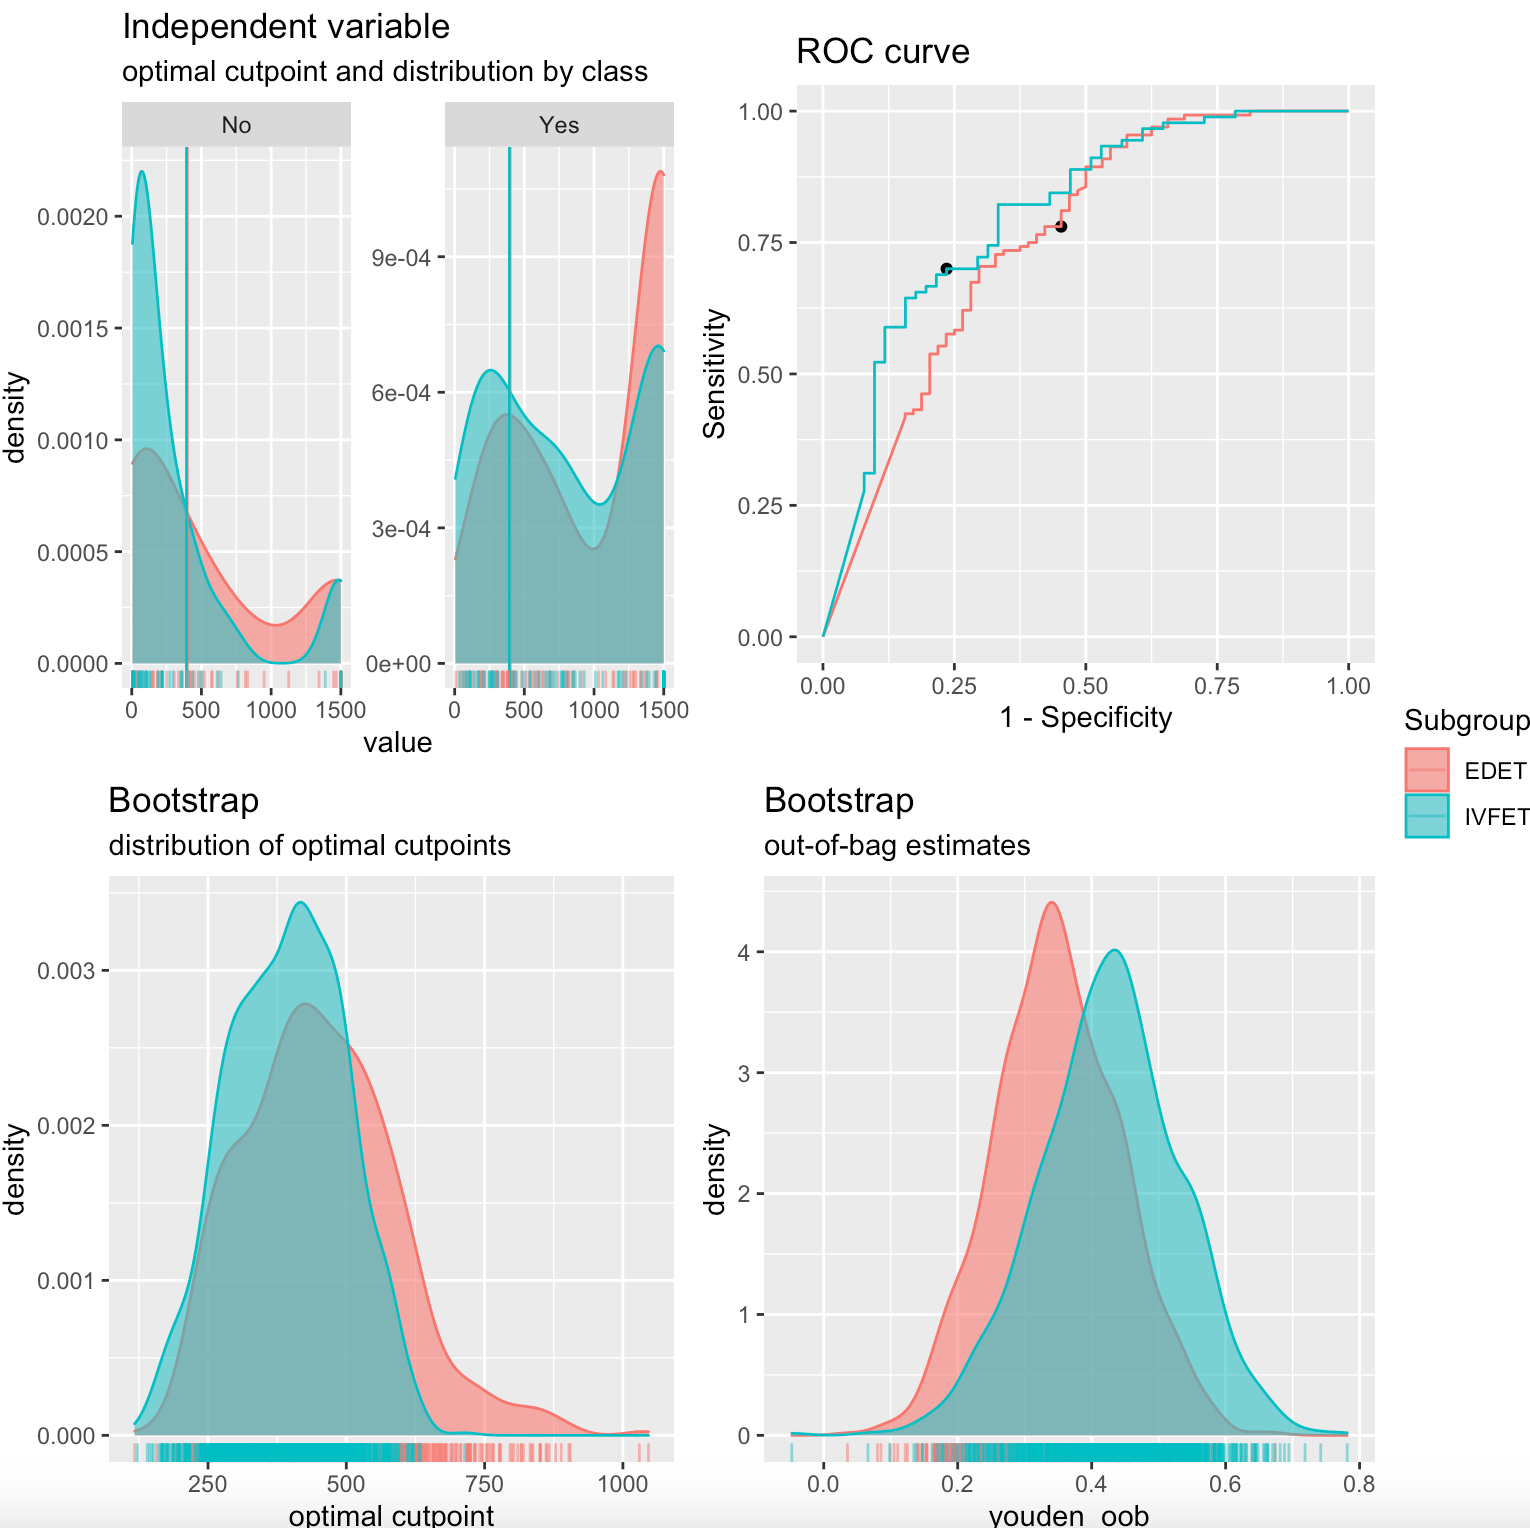
This is the plot generated:

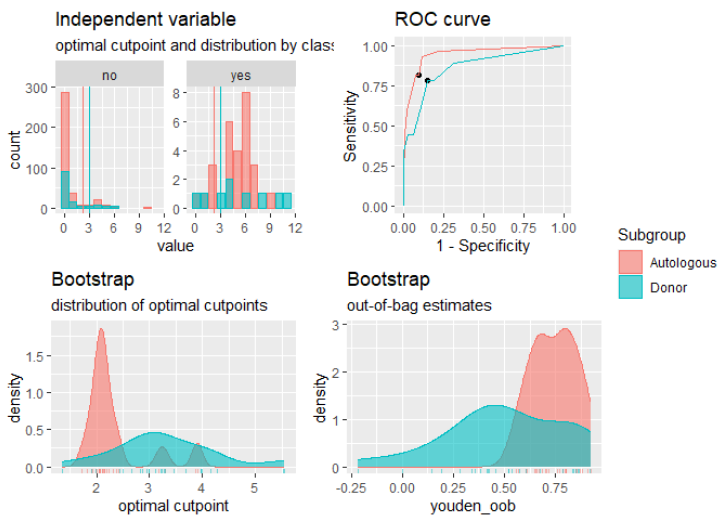
  1. I want to edit the legend title from subgroup to Oocyte source
  2. I want to change the labels EDET to Donor, IVFET to Autologous

I tried working treating the plot object as a ggplot2 plot and running code such as, where p is the said plot object.

p + scale_fill_discrete(name = "Oocyte source", labels = c("Donor", "Autologous"))

Unfortunately, the console returns 'NULL'

This is an example data set:

hcgdf_v2 <-tibble(id = 1:10, beta.hcg = seq(from = 5, to = 1500, length.out = 10), 
       livebirth.factor = c("yes", "no", "yes", "no", "no", "yes", "yes", "no", "no", "yes"), 
       cycle.type = c("edet","ivfet","edet", "edet", "edet", "edet", "ivfet", "ivfet", "ivfet","edet"))

Thank you

There may be a more direct way to achieve the desired outcome, but below are a couple examples that get us there (mostly). Unfortunately, I could not get the dataset you provided to work, so I used the cutpointr::suicide data set.

Base case: below is the original output generated using similar code to what was shared. The subgroup in this case is gender.

library(tidyverse)
library(cutpointr)

opt_cut <- cutpointr(suicide, dsi, suicide, 
                     subgroup = gender, 
                     method = maximize_boot_metric, 
                     metric = youden, boot_runs = 25, 
                     boot_stratify = TRUE, 
                     na.rm = TRUE) %>% 
  add_metric(list(ppv, npv, odds_ratio, risk_ratio, p_chisquared))

plot(opt_cut)

Example 1: Add a new column to the data set name Oocyte source and map the gender values (in this case) to the desired outputs. Then, set subgroup = `Oocyte source` . The legend will show the desired values, but the legend title will still be "Subgroup".

suicide2 = suicide %>%
  mutate(`Oocyte source` = gender) %>%
  mutate(`Oocyte source` = ifelse(`Oocyte source` == 'male', 'Donor', 'Autologous'))

opt_cut2 <- cutpointr(suicide2, dsi, suicide, 
                      subgroup =`Oocyte source`, 
                      method = maximize_boot_metric, 
                      metric = youden, boot_runs = 25, 
                      boot_stratify = TRUE, 
                      na.rm = TRUE) %>% 
  add_metric(list(ppv, npv, odds_ratio, risk_ratio, p_chisquared))

plot(opt_cut2)

Example 2: This case requires the manual creation of the four plot layout using the patchwork package. Using opt_cut2 from Example 1, manually create each of the four plots using various plot_* functions from the cutpointr package. Specify the desired legend title for the first plot and remove legends for the other three. Finally, when generating the final layout, "collect" the guides. For some reason, the ROC curve plot does not fill the entire space, but the legend is as desired.

p1 = plot_x(opt_cut2) + 
  guides(fill = guide_legend(title = 'Oocyte source'), color = 'none') 

p2 = plot_roc(opt_cut2) + theme(legend.position = 'none')

p3 = plot_cut_boot(opt_cut2) + theme(legend.position = 'none')

p4= plot_metric_boot(opt_cut2) + theme(legend.position = 'none')

library(patchwork)
p1 + p2 + p3 + p4 + plot_layout(guides = 'collect', nrow = 2, widths = 1)

Created on 2023-01-15 with reprex v2.0.2.9000

1 Like

This was very helpful @scottyd22. Thank you for the assistance.

This topic was automatically closed 21 days after the last reply. New replies are no longer allowed.

If you have a query related to it or one of the replies, start a new topic and refer back with a link.