Without seeing the plots or data, I can't tell what your problem is. In general, assignments inside of the aes() cause the value of the parameter to change according to the data and assignments outside of the aes() are used for a constant value. I hope this example will be helpful.
DF <- data.frame( Xval = c(1,2,3),
Yval = c(2,2,3))
library(ggplot2)
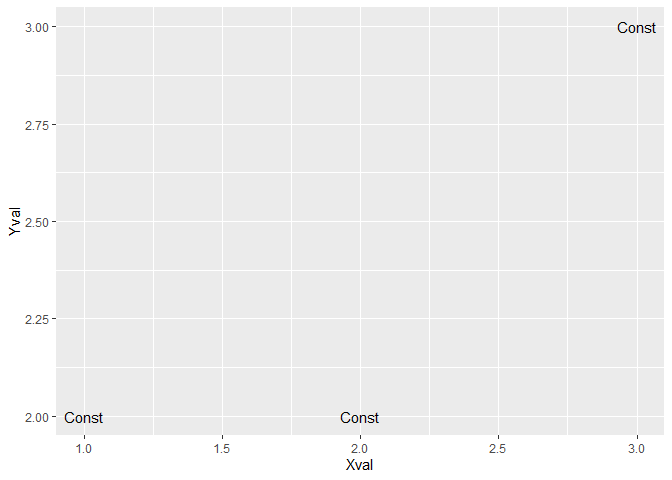
#label is constant, its x an y value change
ggplot(data = DF, aes(x = Xval, y = Yval)) +
geom_text(label = "Const")
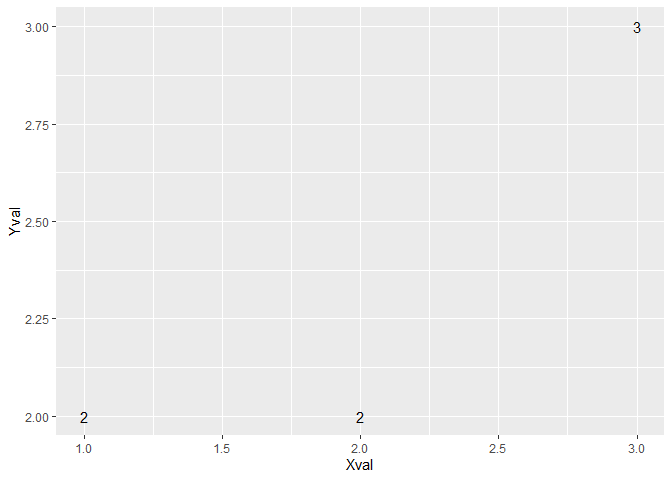
#label changes according to the Yval column
ggplot(data = DF, aes(x = Xval, y = Yval)) +
  geom_text(aes(label = Yval))
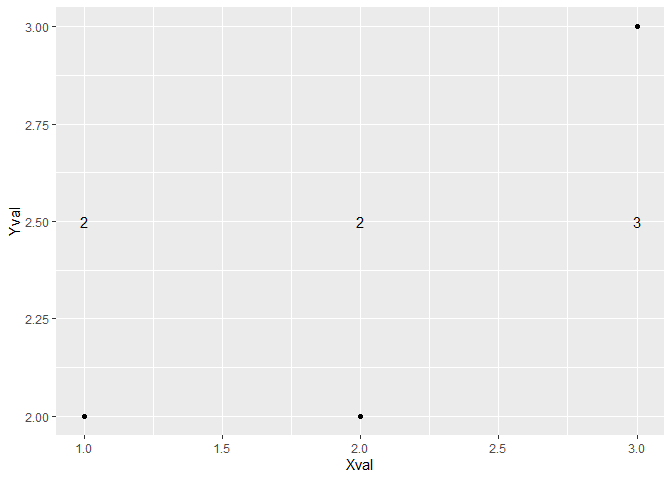
#label changes with Yval but y is constant
ggplot(data = DF, aes(x = Xval, y = Yval)) +
  geom_point() +
  geom_text(aes(label = Yval), y = 2.5)
It is true that both methods give the same result in that case. It is often true that there is more than one way to get a result. Usually, you use data to set values within the aes() but it is possible to do otherwise.
The usual use of the aes() is to map values from the data to features in the plot. You can use it, at lease sometimes, to set fixed values for plot features. Can you explain more about what is confusing you?
I could find any difference in the plot so I was thinking why this happened and how to know when to put variable inside the aes and when to outside, because both gives the same results.
If the intent of the plotting process is to place the word "event" in those three locations, then I agree that either answer works and marking your answer as wrong is incorrect. If the data set has a column named event and the intent is to place the content of that column on the plot, then you need to put event inside the aes and not put it in quotes.