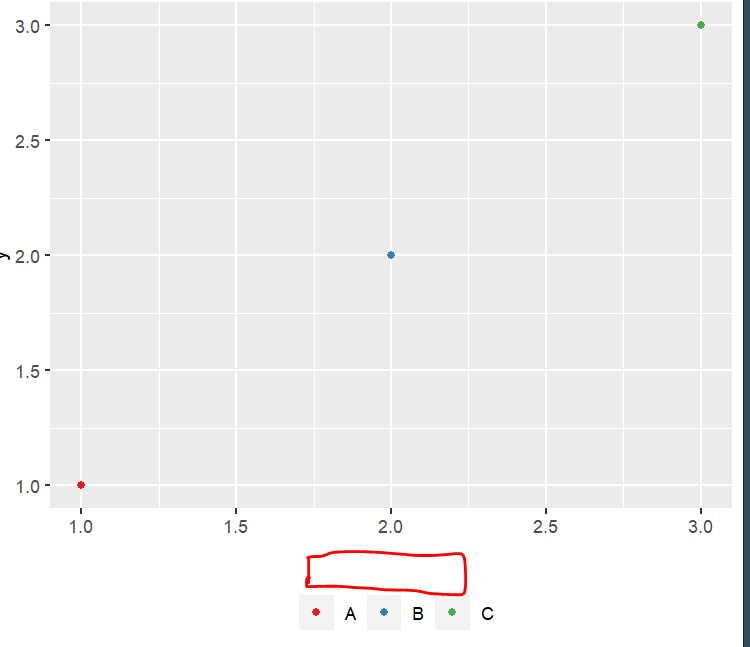
Im want move the lengend name of the top the legend, but I dont know how to make this.
Maybe with legend.position is possible.
library(tidyverse)
# Example data
data <- data.frame(x = 1:3,
y = 1:3,
group = LETTERS[1:3])
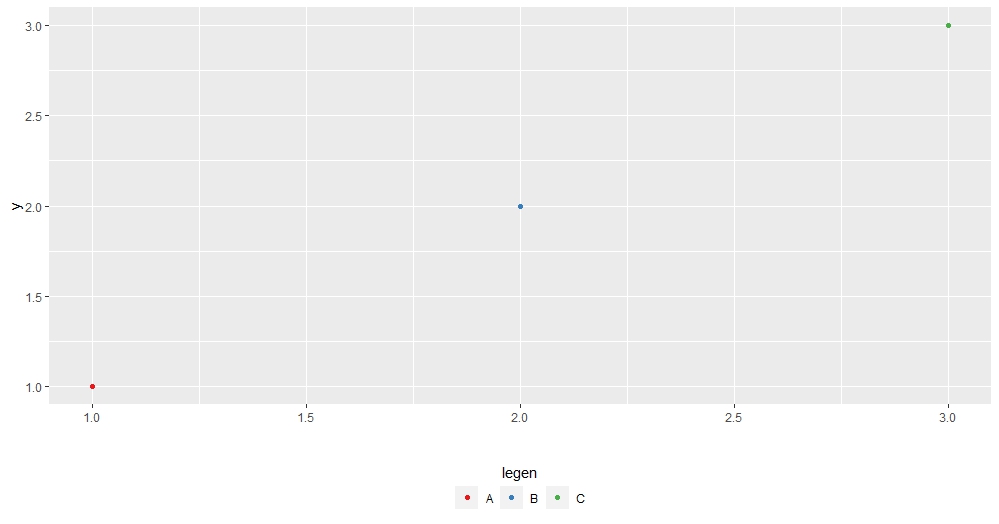
ggplot(data, aes(x, y, color = group)) +
geom_point() +
scale_color_manual(values = c("#E41A1C", "#377EBA", "#4BAD4A"), name='')+ # Im change name
theme(legend.position = "bottom")+
labs(x='')
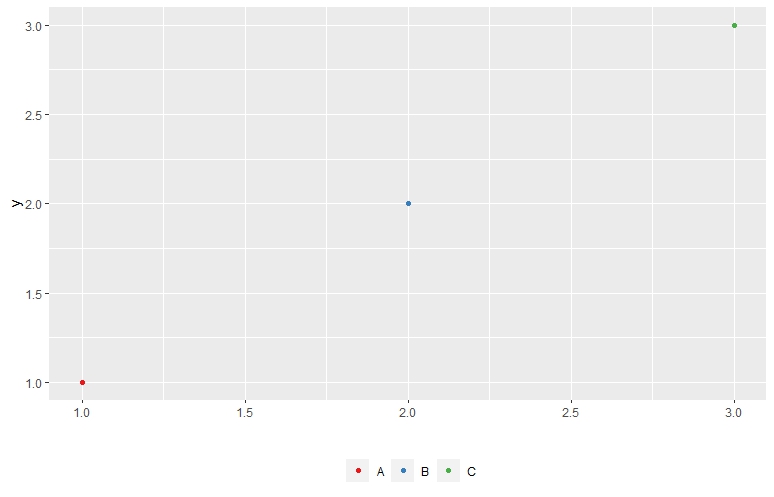
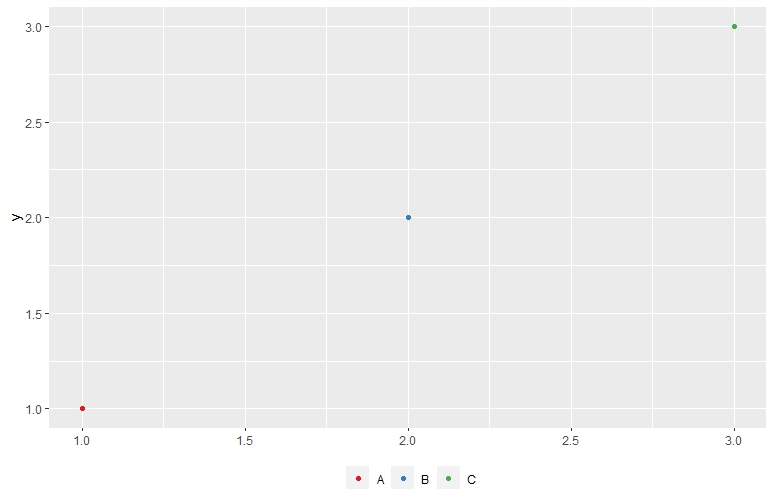
Hi, @M_AcostaCH , you could use theme(legend.margin=margin(-10, 0, 0, 0)) .Follwing is the comparison.
library(tidyverse)
# Example data
data <- data.frame(x = 1:3,
                   y = 1:3,
                   group = LETTERS[1:3])

ggplot(data, aes(x, y, color = group)) +
  geom_point() +
  scale_color_manual(values = c("#E41A1C", "#377EBA", "#4BAD4A"), name='')+ # Im change name
  theme(legend.position = "bottom")+
  labs(x='')+
  theme(legend.margin=margin(-10, 0, 0, 0))
In ggplot2, you can change the position of the legend title using the theme() function and the legend.title argument. Here's an example of how you can adjust the legend title tiktok watermark remover position:
library(ggplot2)
Create a sample plot
p <- ggplot(data = iris, aes(x = Sepal.Width, y = Sepal.Length, color = Species)) +
geom_point()
Adjust the legend title position
p + theme(legend.title = element_text(hjust = 0.5, vjust = -0.5))
In the above code, the `theme()` function is used to modify the appearance of the plot. The `legend.title` argument is set to `element_text()` to specify the properties of the legend title. The `hjust` parameter controls the horizontal alignment of the legend title, where 0.5 represents center alignment. The `vjust` parameter controls the vertical alignment of the legend title, where negative values move the title upward.

Feel free to adjust the `hjust` and `vjust` values according to your specific needs to change the legend title position in ggplot2.