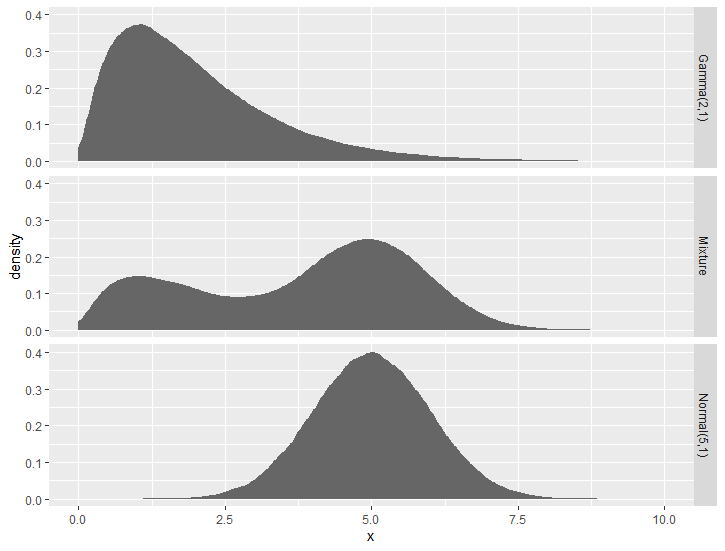
How do you make this plot using the equivalent ggdist geom_* function?
library(distributional)
library(ggdist)
library(tidyverse)

df <- data.frame(
  name = c("Gamma(2,1)", "Normal(5,1)", "Mixture"),
  dist = c(dist_gamma(2,1), dist_normal(5,1),
           dist_mixture(dist_gamma(2,1), dist_normal(5, 1), weights = c(0.4, 0.6)))
)

ggplot(df, aes(y = factor(name, levels = rev(name)))) +
  stat_dist_halfeye(aes(dist = dist)) +
  labs(title = "Density function for a mixture of distributions", y = NULL, x = NULL)
Created on 2023-06-07 with reprex v2.0.2
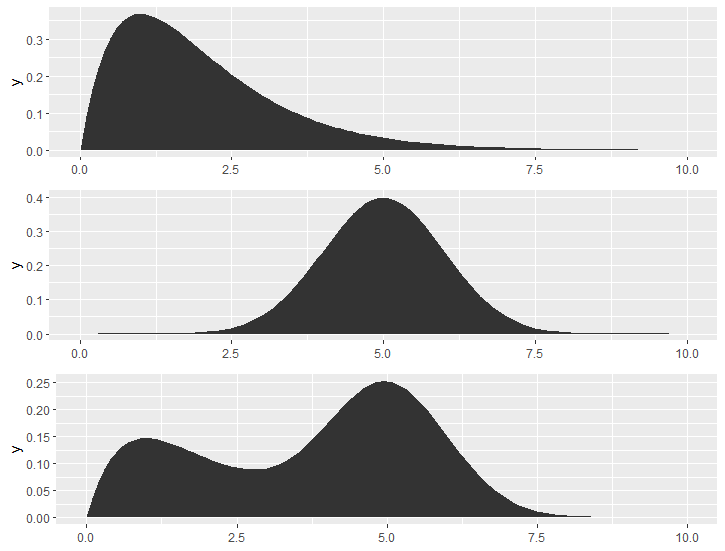
One simple way is to reform the data, because normal geom_* functions won't able to recognize the distribution syntax.
df1 <- df %>% rowwise %>% mutate(x = list(generate(dist, 100000))) %>% unnest_longer(x)
Then it is easy to draw a distribution using stat = "density" in geom_*() functions.
ggplot(df1) +
    geom_area(aes(x = x, group = name), stat = "density", fill = "grey40")+
    facet_grid(rows = vars(name)) +
    xlim(0,10)
If you want perfect smooth line for these distribution curves, you may consider directly draw the density function using stat_function(). but I yet don't know how to vertically parallelly draw the 3 _function layers with only using ggplot2 functions, may be require modifying ggproto(), or looking for help from plot_grid(), but that's too complicated.
library(cowplot)

gama_dis <- ggplot() +
  stat_function(fun = \(x) dgamma(x, shape = 2, rate = 1),geom = "polygon") +
  xlim(0, 10)

normal_dis <- ggplot() +
  stat_function(fun = \(x) dnorm(x, mean = 5, sd = 1), geom = "polygon") +
  xlim(0,10)


mix_dis <- ggplot() +
  stat_function(fun = \(x) 0.4 * dgamma(x, shape = 2, rate = 1) + 0.6 * dnorm(x, mean = 5, sd = 1),
                geom = "polygon") +
  xlim(0,10)

plot_grid(gama_dis, normal_dis, mix_dis, ncol = 1)
2 Likes
system
June 14, 2023, 10:09am
3
This topic was automatically closed 7 days after the last reply. New replies are no longer allowed.