How to add secondary axis in multiple barplots in ggplot?

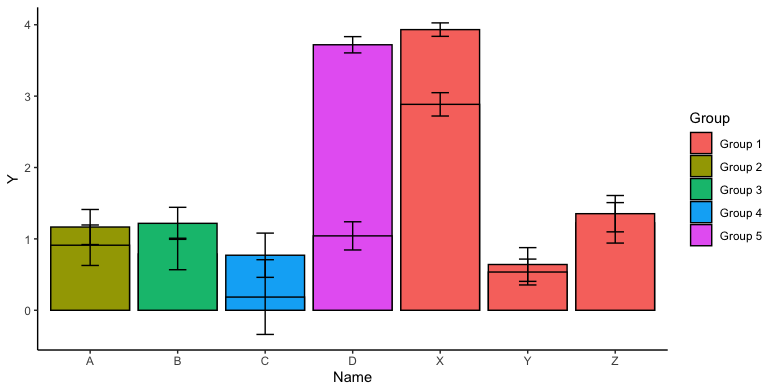
Hello. I'm struggling with plotting these data in ggplot. I want a secondary x-axis for a multiple barplots that denotes the Subgroup. What I currently have is one-level x-axis wherein the data for the Subgroup is superimposed rather than a side-by-side barplot. Here's the data and the plot that I have generated so far:

# Create some sample data
df = tribble(~Col,~Name,~Subgroup,~Group,~Mean,~Error,
             1,'X',1,'Group 1',3.5,0.1,
             2,'Y',1,'Group 1',4.9,0.2,
             3,'Z',1,'Group 1',1.2,0.2,
             4,'A',1,'Group 2',1.1,0.2,
             5,'B',1,'Group 3',0.7,0.2,
             6,'C',1,'Group 4',0.8,0.3,
             7,'D',1,'Group 5',3.7,0.1,
             8,'X',2,'Group 1',2.8,0.1,
             9,'Y',2,'Group 1',1.5,0.1,
             10,'Z',2,'Group 1',1.3,0.2,
             11,'A',2,'Group 2',1.2,0.2,
             12,'B',2,'Group 3',1.5,0.2,
             13,'C',2,'Group 4',0.9,0.5,
             14,'D',2,'Group 5',1.1,0.1
  
)

y1 = ggplot(df, aes(x=Name, y=Mean, fill=Group)) +
  theme_classic() + labs(y = 'Y') +
  geom_bar(position=position_dodge(), stat="identity", colour='black') +
  geom_errorbar(aes(ymin= Mean - Error, 
                    ymax= Mean + Error),
                width=.2,
                position=position_dodge(.9))

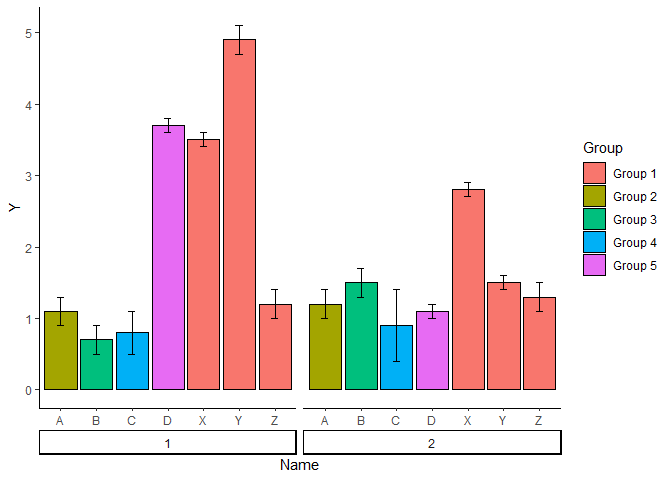
I want to remove the legend since the primary x-axis (i.e. Name) for the identification. What I want here is a secondary axis for the Subgroup. It should look something like this except for the facet_group.

Let me know if you have an idea how to do this. Thanks!

Here's some options as I didn't quite understand whether you wanted my choice 1 or choice 2.

library(tidyverse)

# Create some sample data
df = tribble(~Col,~Name,~Subgroup,~Group,~Mean,~Error,
             1,'X',1,'Group 1',3.5,0.1,
             2,'Y',1,'Group 1',4.9,0.2,
             3,'Z',1,'Group 1',1.2,0.2,
             4,'A',1,'Group 2',1.1,0.2,
             5,'B',1,'Group 3',0.7,0.2,
             6,'C',1,'Group 4',0.8,0.3,
             7,'D',1,'Group 5',3.7,0.1,
             8,'X',2,'Group 1',2.8,0.1,
             9,'Y',2,'Group 1',1.5,0.1,
             10,'Z',2,'Group 1',1.3,0.2,
             11,'A',2,'Group 2',1.2,0.2,
             12,'B',2,'Group 3',1.5,0.2,
             13,'C',2,'Group 4',0.9,0.5,
             14,'D',2,'Group 5',1.1,0.1
             
)

y1 = ggplot(df, aes(x=Name, y=Mean, fill=Group)) +
  theme_classic() + labs(y = 'Y') +
  geom_bar(position=position_dodge(), stat="identity", colour='black') +
  geom_errorbar(aes(ymin= Mean - Error, 
                    ymax= Mean + Error),
                width=.2,
                position=position_dodge(.9))
y1 +
  facet_wrap(~Subgroup, nrow=1, strip.position = "bottom") +
  theme(strip.placement = "outside")


y2 = ggplot(df, aes(x=as.factor(Subgroup), y=Mean, fill=Group)) +
  theme_classic() + labs(y = 'Y') +
  geom_bar(position=position_dodge(), stat="identity", colour='black') +
  geom_errorbar(aes(ymin= Mean - Error, 
                    ymax= Mean + Error),
                width=.2,
                position=position_dodge(.9))

y2 +
  facet_wrap(~Name, nrow=1, strip.position = "bottom") +
  theme(strip.placement = "outside")

Created on 2023-01-18 with reprex v2.0.2

2 Likes

Woaah! Thank you for this! This is what I'm looking for.

But is it possible to add a gradient to the groupings? This means that subgroup 1 has a darker shade compared to subgroup 2 so the difference can be seen immediately. Or is this not possible?

Thank you!

The second one really works well!

You can adjust the alpha to do this as follows:

y2 = ggplot(df, aes(x=as.factor(Subgroup), y=Mean, fill=Group, alpha=as.factor(Subgroup))) +
  theme_classic() + labs(y = 'Y') +
  geom_bar(position=position_dodge(), stat="identity", colour='black') +
  geom_errorbar(aes(ymin= Mean - Error, 
                    ymax= Mean + Error),
                width=.2,
                position=position_dodge(.9)) +
  scale_alpha_discrete(range=c(c(0.4, .9))) +
  guides(alpha="none")

y2 +
  facet_wrap(~Name, nrow=1, strip.position = "bottom") +
  theme(strip.placement = "outside")

This topic was automatically closed 21 days after the last reply. New replies are no longer allowed.

If you have a query related to it or one of the replies, start a new topic and refer back with a link.