I used this code to create values for color palette.
eg1 <- expand.grid( blue=seq(1, length.out=13, by=2),
                    red=seq(1,70, by=10))
eg2 <- within(eg1, mix <- rgb(green=0, red=red, blue=blue, maxColorValue =70))

ggplot(eg2, aes(x=red, y=blue)) + geom_tile(aes(fill=mix), color="white") +
scale_fill_identity()
That gives me this:
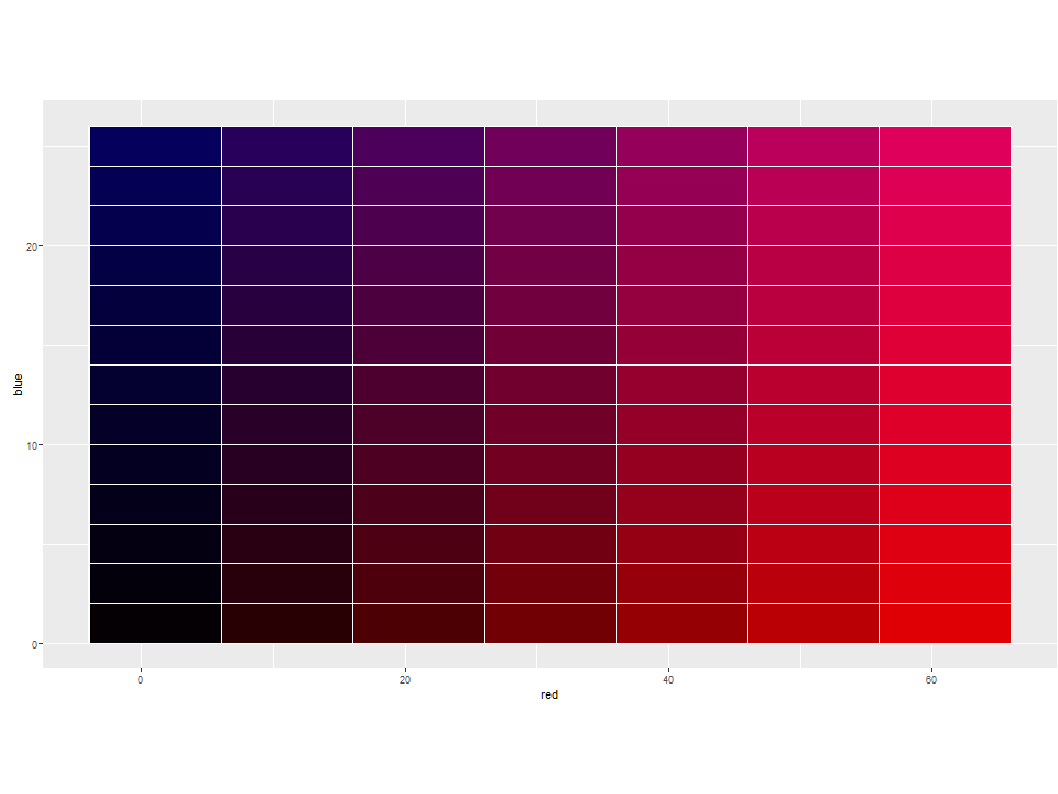
I want to change the tick values on both axes. For the x axis, I want values from 1 to 7 and for the y axis, 1 to 13. I tried the following:
ggplot(eg2, aes(x=red, y=blue)) + geom_tile(aes(fill=mix), color="white") +
scale_fill_identity(breaks=c(10,20,30,40,50,60,70), labels=c(1,2,3,4,5,6,7))

ggplot(eg2, aes(x=red, y=blue)) + geom_tile(aes(fill=mix), color="white") +
scale_fill_identity(x=c(1,2,3,4,5,6,7))

ggplot(eg2, aes(x=red, y=blue)) + geom_tile(aes(fill=mix), color="white") +
scale_fill_identity(guide_axis(c(1,2,3,4,5,6,7)))
But none of them did what I was hoping. How can I change the tick values?
