circos.par("track.height" = 0.1, start.degree=90)
start.degree=90
circos.initialize(génome$Chromosome, xlim=matrice)
circos.track(génome$Chromosome, y=matrice$fin,
panel.fun = function(x, y) {
circos.text(CELL_META$xcenter,
CELL_META$cell.ylim[2] + mm_y(5),
CELL_META$sector.index,cex=0.5)
circos.axis(labels.cex = 0.6)
})
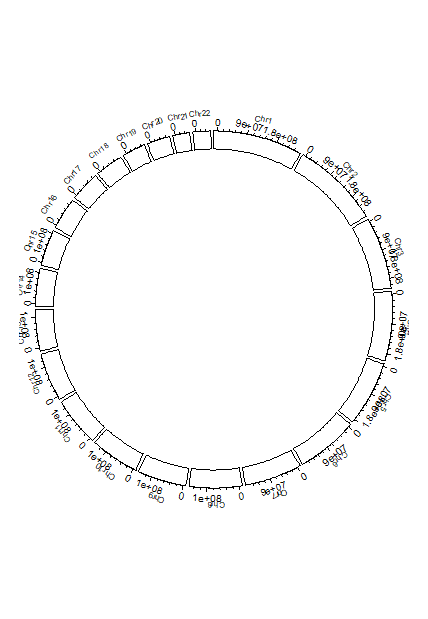
that's the image and i want to color all the 22 cells but i don't know how
Hi, thanks for the reply but already look and doesn't work to colors each cells with differents colors
1 Like
system
Closed
5
This topic was automatically closed 21 days after the last reply. New replies are no longer allowed.
If you have a query related to it or one of the replies, start a new topic and refer back with a link.