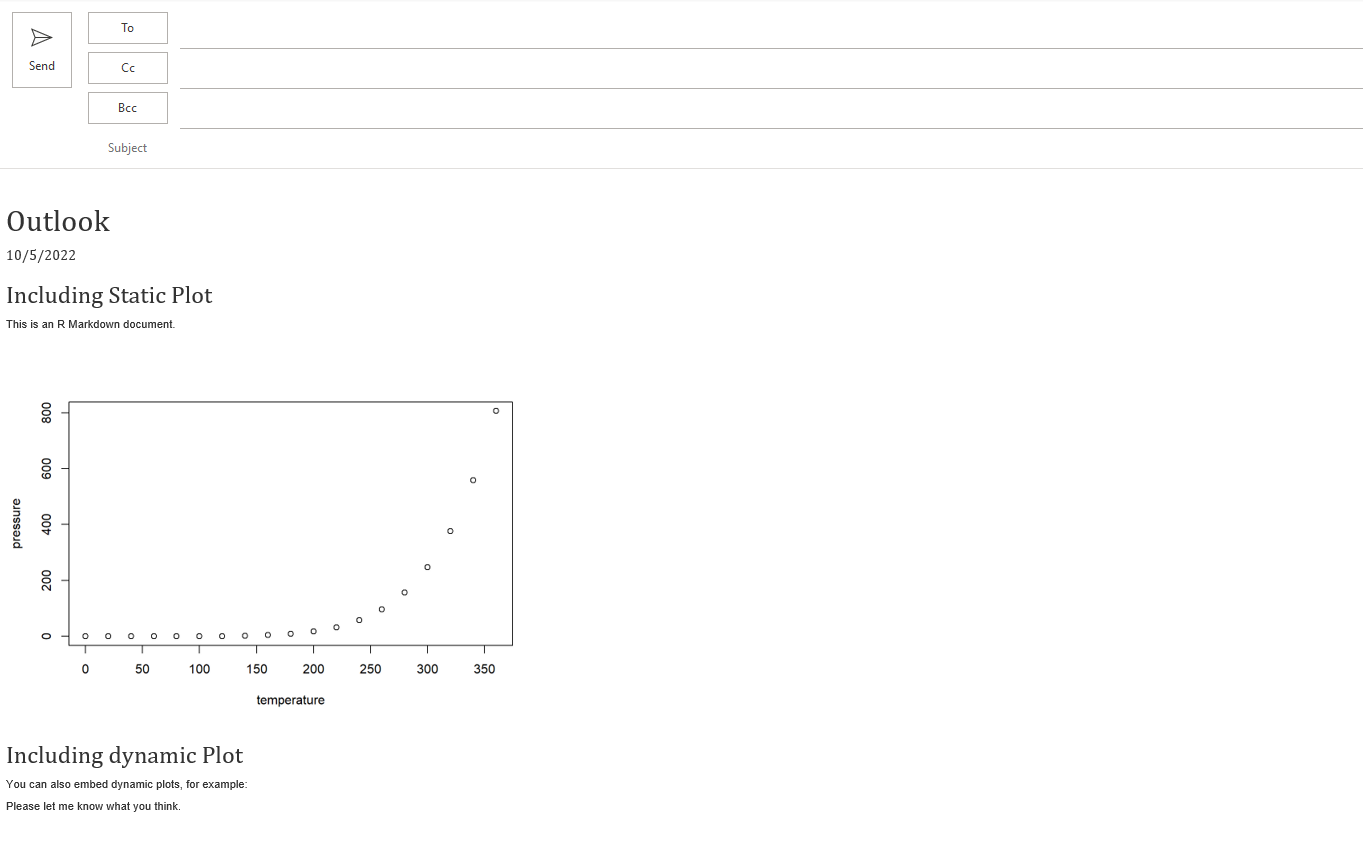
I am trying to embed an html file produced from R Markdown into the outlook email. I can do it by choosing Insert/Insert as Text, but it only shows texts and static charts. As an example, it shows all contents except the dygraphs plot.
I am thankful if anyone knows how to embed htmlwidgets such as Plotly, dygraphs, etc. into an outlook email. Please find below R markdown scripts along with what email shows.
Usually you can't send any HTML content by email. HTML produce by the html_document format are full feature HTML with some CSS and JS content that you can't have in an email.
I would use specific format like
Or just add your self contained html to attachement in the email (with a simple blastula Rmd created content)