Thanks for sharing some data. After reviewing it more, I went back to the drawing board. I looked at the documentation for geom_text() and noticed whenever parse = TRUE, the labels will be parsed into expressions and displayed according to plotmath, which I'm not familiar with. Long story short, the transformations I attempted to make broke this process, and the labels wouldn't display properly.
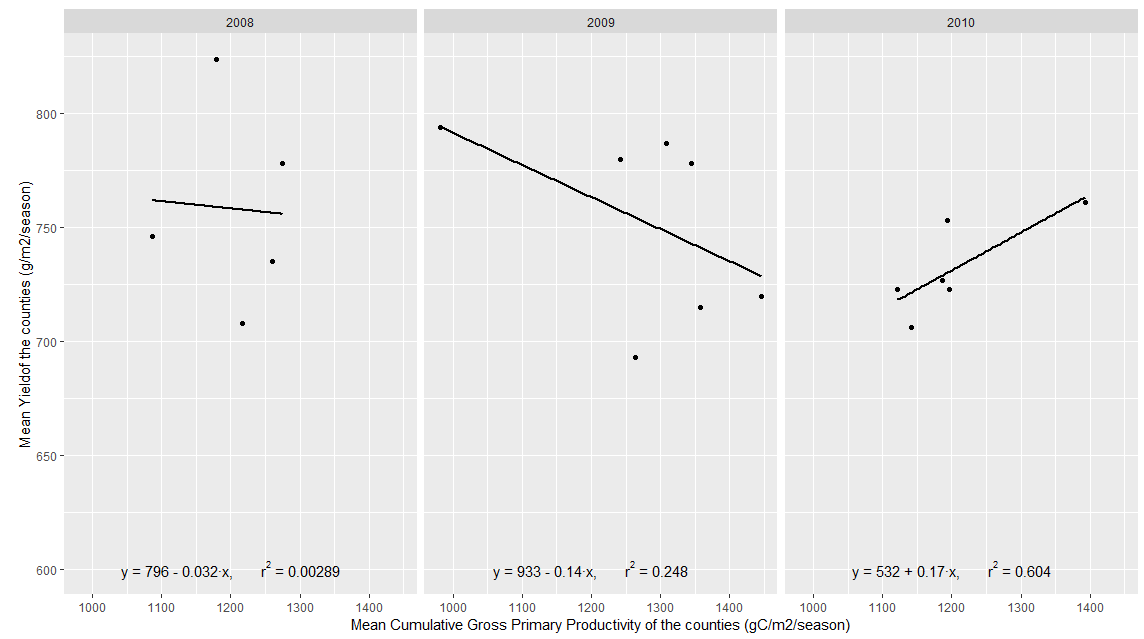
So, I decided to use the ggtext package for displaying the output. The code below breaks apart the character strings and reassembles them into HTML strings. Admittedly, this is not an elegant solution, but I think it gets to your final goal. Notice for the plot, geom_text is replaced with geom_richtext.
library(tidyverse)
library(plyr)
# sample data provided
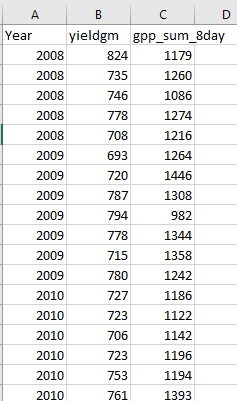
gppricecounty = tibble(
Year = c(rep(2008, 5), rep(2009, 7), rep(2010, 6)),
yieldgm = c(824, 735, 746, 778, 708, 693, 720, 787, 794,
778, 715, 780, 727, 723, 706, 723, 753, 761),
gpp_sum_8day = c(1179, 1260, 1086, 1274, 1216, 1264, 1446, 1308, 982,
1344, 1358, 1242, 1186, 1122, 1142, 1196, 1194, 1393)
)
lm_eqn = function(gppricecounty){
m = lm(yieldgm ~ gpp_sum_8day, gppricecounty);
eq <- substitute(italic(y) == a + b %.% italic(x)*","~~italic(R)^2~"="~r2,
list(a = format(coef(m)[1], digits = 2),
b = format(coef(m)[2], digits = 2),
r2 = format(summary(m)$r.squared, digits = 3)))
as.character(as.expression(eq));
}
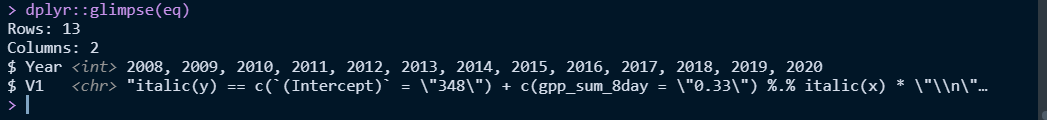
# original eq data
eq <- plyr::ddply(gppricecounty, .(Year),lm_eqn)
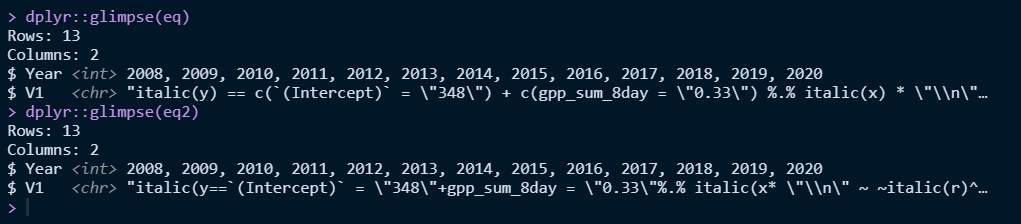
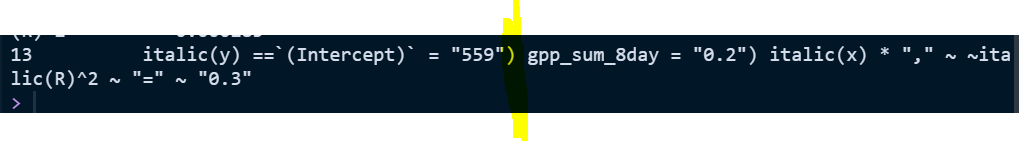
# transformation steps resulting in a table with Year and Label
eq = eq %>%
# split the string apart into new columns
separate(V1, into = c('V2', 'V3'), sep = '\\+') %>%
separate(V3, into = c('V4', 'V5'), sep = '%.%') %>%
separate(V5, into = c('V6', 'V7'), sep = '\\* "," ~ ~') %>%
separate(V7, into = c('V8', 'V9'), sep = ' ~ "=" ~') %>%
mutate_all(~str_squish(.)) %>%
# clean/transform the columns
mutate(V2 = paste0('y = ', str_extract(V2, '\".*\"'))) %>%
mutate(V2 = str_replace_all(V2, '\\"', '')) %>%
mutate(V2 = str_replace(V2, 'y', '<i>y</i>')) %>%
mutate(V4 = str_extract(V4, '\".*\"')) %>%
mutate(V4 = str_replace_all(V4, '\\"', '')) %>%
mutate(V6 = str_extract(V6, '\\(.*\\)')) %>%
mutate(V6 = str_replace_all(V6, '\\(|\\)', '')) %>%
mutate(V8a = paste0(str_extract(V8, '\\(.*\\)'))) %>%
mutate(V8a = str_replace_all(V8a, '\\(|\\)', '')) %>%
mutate(V8a = paste0(tolower(V8a), '<sup>', substr(V8, nchar(V8) - 1, nchar(V8)), '</sup>')) %>%
mutate(V9 = str_replace_all(V9, '\\"', '')) %>%
# assemble final label
mutate(Label = paste0(V2, ' + ', V4, '∙', V6, ', ', V8a, ' = ', V9)) %>%
# turn math symbols plus minus (+ -) into a single minus (-)
mutate(Label = str_replace(Label, ' \\+ -', ' - ')) %>%
# keep only two columns
select(Year, Label)
library(ggtext)
p <- ggplot(data = gppricecounty, aes(x = gpp_sum_8day, y = yieldgm)) +
geom_smooth(method = "lm", se=FALSE, color="black", formula = y ~ x) +
geom_point()+
xlab("Mean Cumulative Gross Primary Productivity of the counties (gC/m2/season)")+
ylab("Mean Yieldof the counties (g/m2/season)")
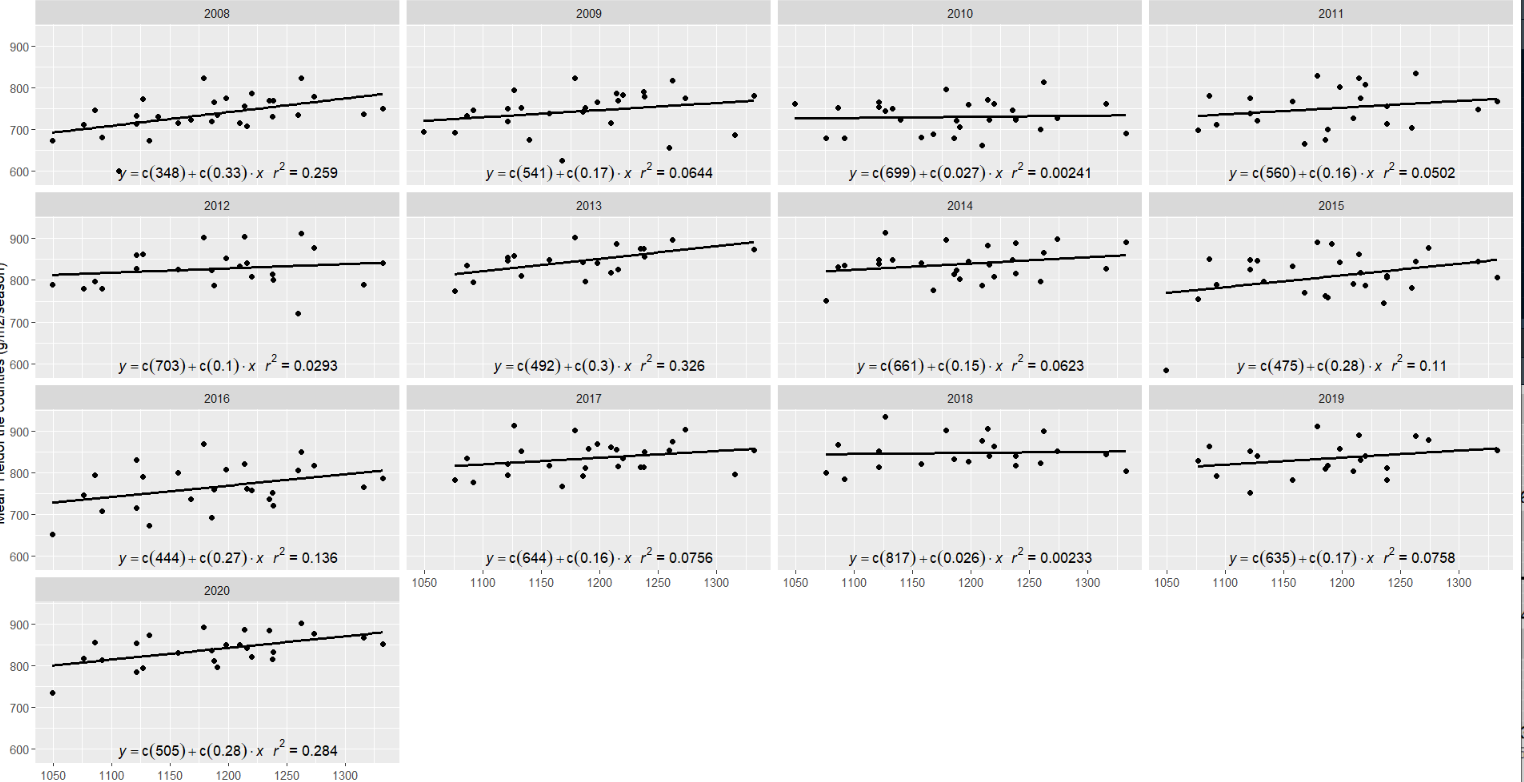
p1 = p +
geom_richtext(data=eq,
aes(x = 1200, y = 600, label = Label),
inherit.aes=FALSE,
fill = NA,
label.color = NA) +
facet_wrap(Year ~ .)
p1