Its about a dataset containing chemical tests on blood samples and there result time. With the aggregate function, I combine/count the amount of tests that are done in each hour.
I have this kind of output dataframe:
hours | count
0 | 256
1 | 357
2 | 290
3 | 458
...
...
22 | 674
23 | 241
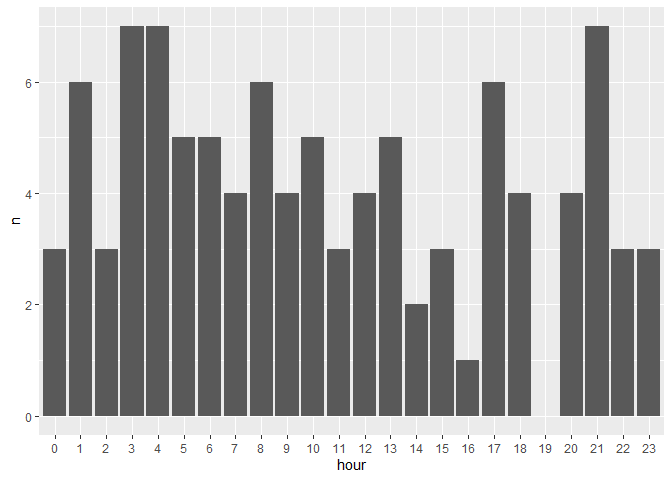
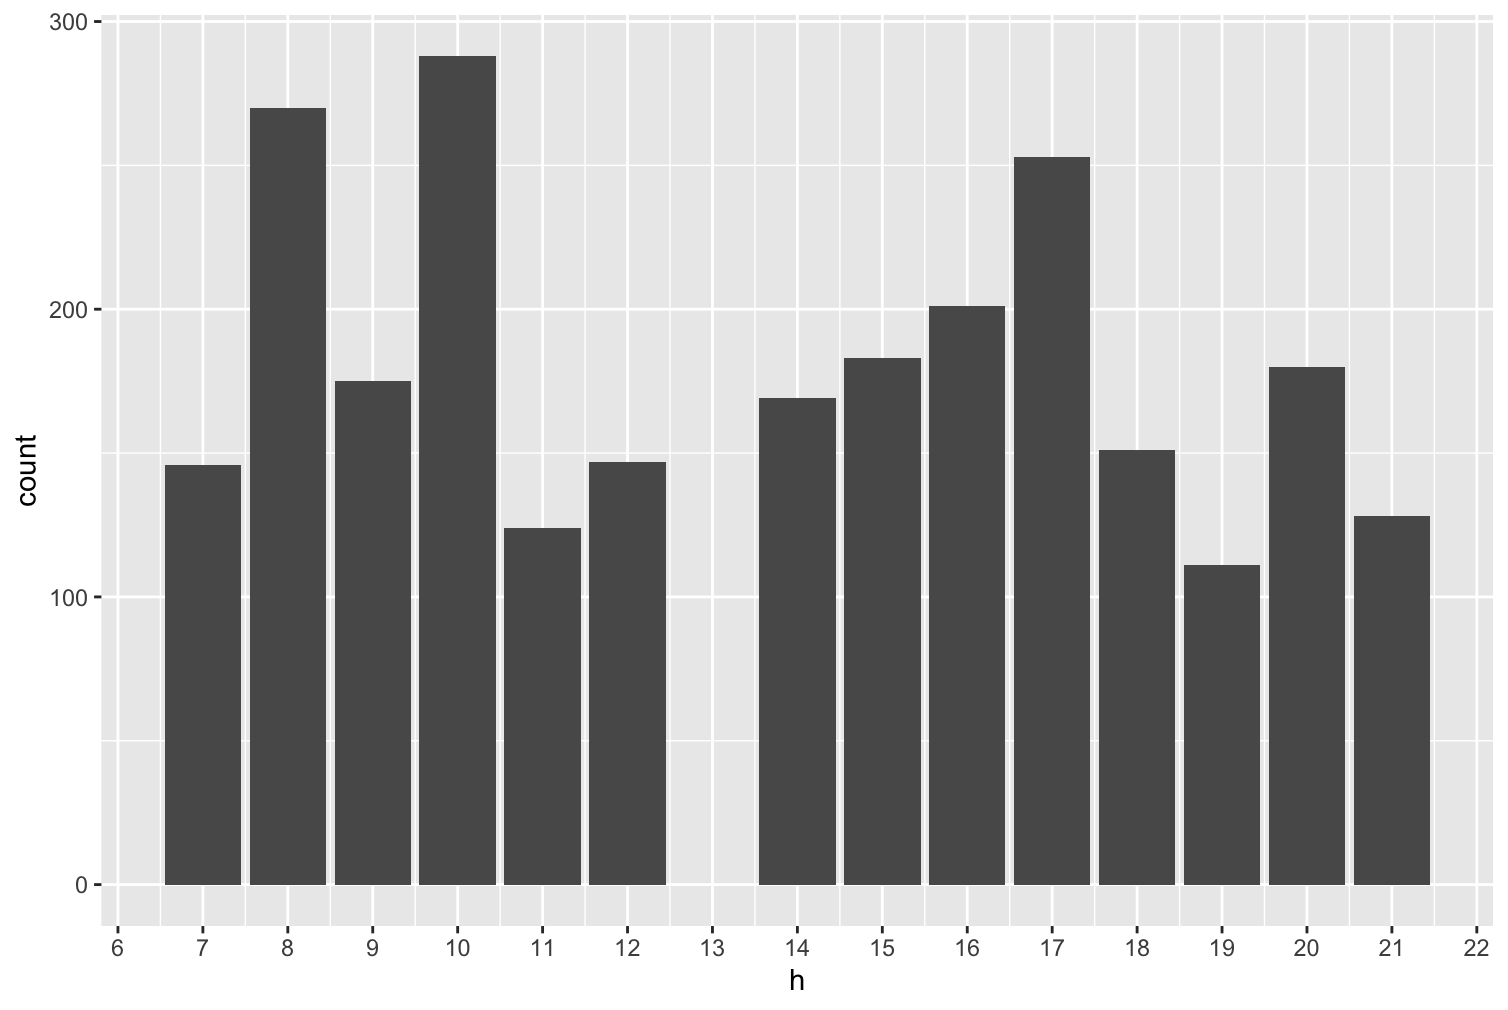
When every hour a test is done, it is listed, but image that the lab closes (not test are done from 7h-14h) ,than there is a gap and the following barplot is wrong by showing less than 24 bars. I have an example of a test that is done 2 time a day, so when I apply the filter of that test on that dataset and try to aggregate again, I have a dataframe with only 2 rows and thus a barplot with only 2 bars (and no 24 bars like I want).
hour | count
17h | 769
21h | 564
How can I code that the hour colomn reaches from 0 untill 23 and if there are no counts for that hour, it adds 0, so the bar plot will have 24 bars (even when the bar represents 0)?
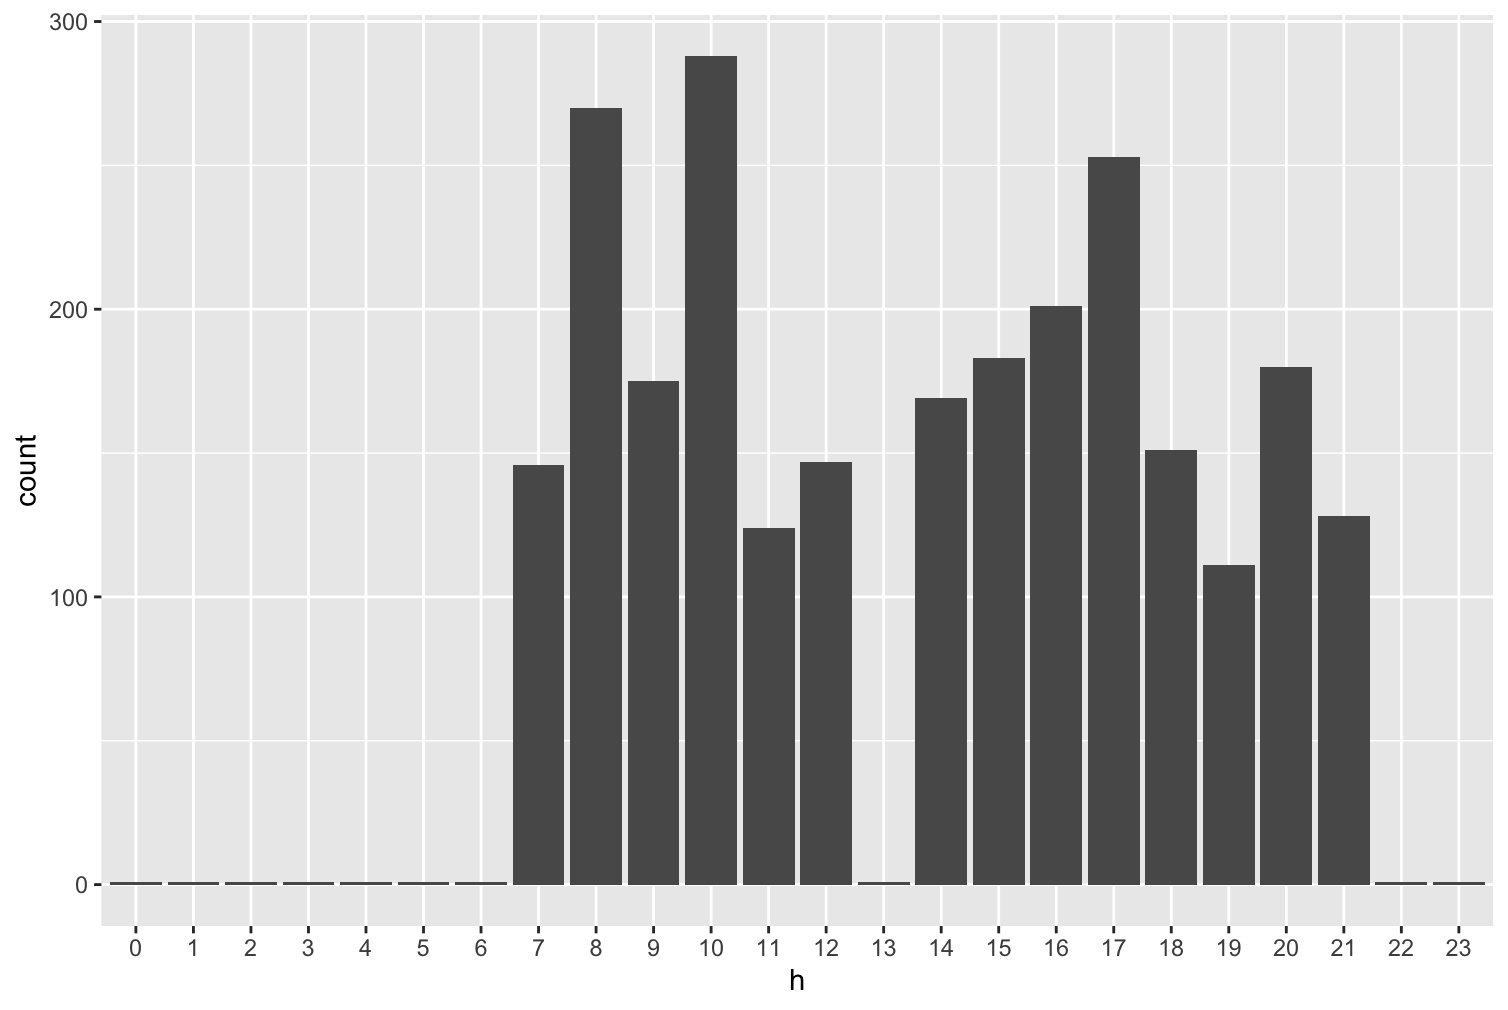
Another approach is to summarize the data with the count() function from dplyr and set the .drop argument to FALSE so that any missing hours are listed with a zero.