How to pass parameter values?

Hi:

I would like to have dimensions of the 'pattern' adapted to the m and n values, but I don't know how to pass 'input$m' and 'input$n' to 'checkboxes'. Because of that I have set them to the maximum (6).

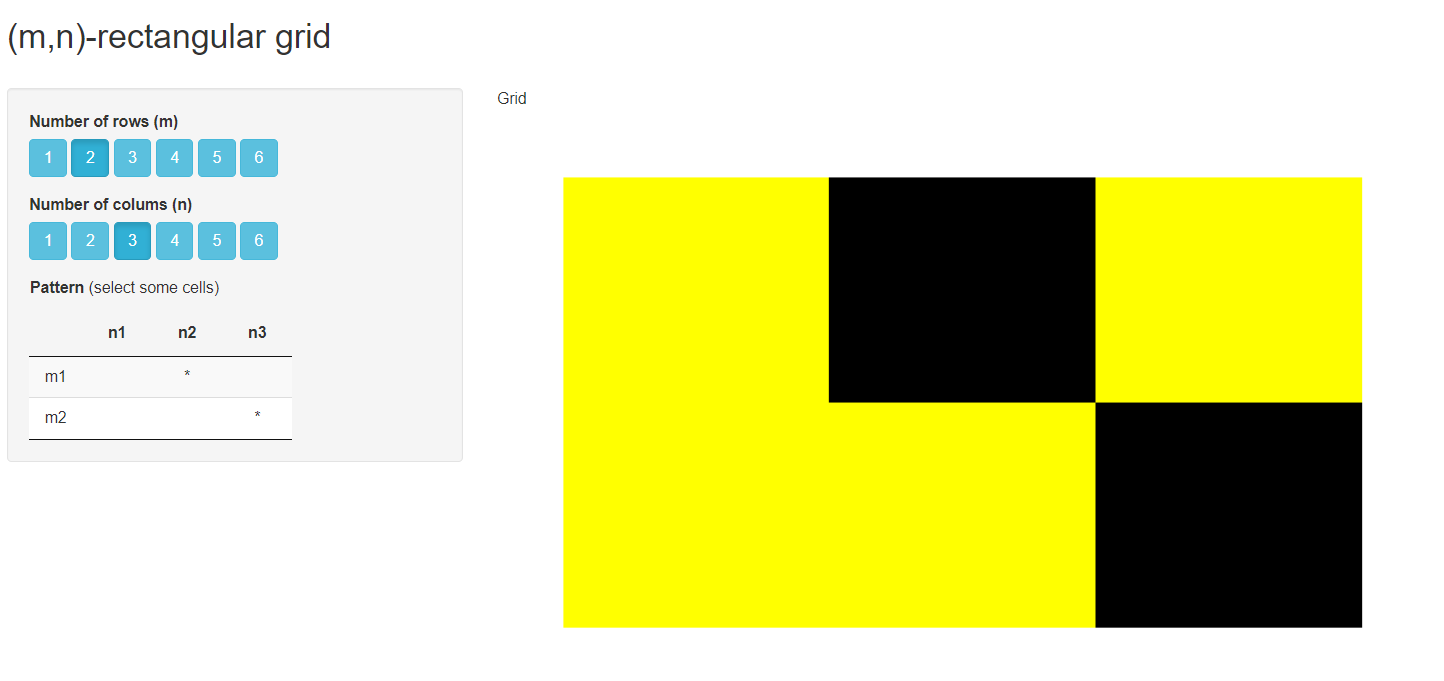
However, 'grid' is adapted to dimensions, reflecting the selection of cells within the bounds of 'input$m and 'input$n'. In this case both parameters are inside a function ('renderImage()'), unlike 'pattern'.

Another solution could be a sensible 'grid'. That is to say, the capacity to select cells on 'grid' instead of 'pattern'.

Can you help me? Thank you.

######################################################################################

library(shiny)
library(shinyWidgets)
library(DT)

######################################################################################

ui <- fluidPage(
titlePanel("(m,n)-rectangular grid"),
br(),
sidebarLayout(
sidebarPanel(
fluidRow(column(8, radioGroupButtons(inputId = "m", label = "Number of rows (m)",
choices = as.character(1:6), selected = "3", status = "info", individual = TRUE))),

             fluidRow(column(8, radioGroupButtons(inputId = "n", label = "Number of colums (n)",
                                    choices = as.character(1:6), selected = "4", status = "info", individual = TRUE))),

             fluidRow(
               HTML("<p>&nbsp;&nbsp;&nbsp;&nbsp;<b>Pattern</b> (select some cells)</p>") ),
             
             fluidRow(column(8, DT::dataTableOutput(outputId = "pattern"))) 
),   # sidebarPanel

mainPanel("Grid", imageOutput(outputId = "grid"))

) # sidebarLayout
) # fluidPage

server <- function(input, output, session) {
proxy <- dataTableProxy('pattern')

nrow <- as.integer(input$m)

ncol <- as.integer(input$n)

nrow <- 6
ncol <- 6

checkboxes <- as.data.frame(matrix(rep(NA, nrow*ncol), nrow = nrow, ncol = ncol,
dimnames = list(paste("m", 1:nrow, sep = ""),
paste("n", 1:ncol, sep = ""))))

tableData = reactiveValues(checkboxes = checkboxes)

observeEvent(req(input$pattern_cells_selected), {
tableData$checkboxes[input$pattern_cells_selected] =
ifelse(is.na(tableData$checkboxes[input$pattern_cells_selected]),
"*", NA)
replaceData(proxy = proxy, data = tableData$checkboxes)
}) # observeEvent

output$pattern <- DT::renderDataTable({ checkboxes },
selection = list(mode = "single", target = 'cell'),
options = list(columnDefs = list(list(className = 'dt-center', targets = "_all")),
dom = "t", ordering = FALSE),
escape = FALSE
) # renderDataTable

output$grid <- renderImage({
nrow <- as.integer(input$m)
ncol <- as.integer(input$n)
pattern <- matrix(rep(0, nrow*ncol), nrow = nrow, ncol = ncol)

for(row in 1:nrow) for(col in 1:ncol)
  ifelse(tableData$checkboxes[row,col] == "*", pattern[row, col] <- 1, 0)
pattern <- pattern[nrow(pattern):1,]
pattern <- t(pattern)
  
palette <- c("yellow", "black")
 
outfile <- tempfile(fileext = '.png')
w <- 800
h <- nrow/ncol*w
png(outfile, width = w, height = h)
image(pattern, col = palette, axes = FALSE)
dev.off()     
list(src = outfile)

}, deleteFile = TRUE) # renderImage

} # server

shinyApp(ui, server)

Welcome to the community @yosu! Below is the code you provided with a few updates. First, nrow, ncol, and checkboxes were all turned into reactives in order to pass these parameters. Then, an observe() was added in order to update tableData. Finally, I updated how pattern was created within output$grid. I couldn't get the two for() statements to work so I commented it out. I hope this achieves your desired output.

library(shiny)
library(shinyWidgets)
library(DT)

######################################################################################

ui <- fluidPage(
  titlePanel("(m,n)-rectangular grid"),
  br(),
  sidebarLayout(
    sidebarPanel(
      fluidRow(column(8, radioGroupButtons(inputId = "m", label = "Number of rows (m)",
                                           choices = as.character(1:6), selected = "3", status = "info", individual = TRUE))),
      
      fluidRow(column(8, radioGroupButtons(inputId = "n", label = "Number of colums (n)",
                                           choices = as.character(1:6), selected = "4", status = "info", individual = TRUE))),
      
      fluidRow(
        HTML("<p>&nbsp;&nbsp;&nbsp;&nbsp;<b>Pattern</b> (select some cells)</p>") ),
      
      fluidRow(column(8, DT::dataTableOutput(outputId = "pattern"))) 
    ),   # sidebarPanel
    
    mainPanel("Grid", imageOutput(outputId = "grid"))
  ) # sidebarLayout
) # fluidPage

server <- function(input, output, session) {
  proxy <- dataTableProxy('pattern')
  
  nrow <- reactive({as.integer(input$m)})
  ncol <- reactive({as.integer(input$n)})
  
  checkboxes <- reactive({
    as.data.frame(matrix(rep(NA, nrow()*ncol()), nrow = nrow(), ncol = ncol(),
                         dimnames = list(paste("m", 1:nrow(), sep = ""),
                                         paste("n", 1:ncol(), sep = ""))))
  })
    
  observe({tableData$checkboxes <<- checkboxes()})
  
  tableData = reactiveValues(checkboxes = NULL)
  
  observeEvent(req(input$pattern_cells_selected), {
    tableData$checkboxes[input$pattern_cells_selected] =
      ifelse(is.na(tableData$checkboxes[input$pattern_cells_selected]),
             "*", NA)
    replaceData(proxy = proxy, data = tableData$checkboxes)
  }) # observeEvent
  
  output$pattern <- DT::renderDataTable({ checkboxes() },
                                        selection = list(mode = "single", target = 'cell'),
                                        options = list(columnDefs = list(list(className = 'dt-center', targets = "_all")),
                                                       dom = "t", ordering = FALSE),
                                        escape = FALSE
  ) # renderDataTable
  
  output$grid <- renderImage({
    
    pattern = tableData$checkboxes
    pattern[pattern == '*'] = 1
    pattern[is.na(pattern)] = 0
    pattern = matrix(as.numeric(unlist(pattern)), nrow = nrow(), ncol = ncol())
    
    # pattern <- matrix(rep(0, nrow()*ncol()), nrow = nrow(), ncol = ncol())
    # for(row in 1:nrow()) for(col in 1:ncol)
    #   ifelse(tableData$checkboxes[row,col] == "*", pattern[row, col] <- 1, 0)
    pattern <- pattern[base::nrow(pattern):1,]
    pattern <- t(pattern)
    
    palette <- c("yellow", "black")
    
    outfile <- tempfile(fileext = '.png')
    w <- 800
    h <- nrow()/ncol()*w
    png(outfile, width = w, height = h)
    image(pattern, col = palette, axes = FALSE)
    dev.off()     
    list(src = outfile)
  }, deleteFile = TRUE) # renderImage
  
} # server

shinyApp(ui, server)

Thank you very much scottyd22

Thank you very much scottyd22

This topic was automatically closed 42 days after the last reply. New replies are no longer allowed.

If you have a query related to it or one of the replies, start a new topic and refer back with a link.