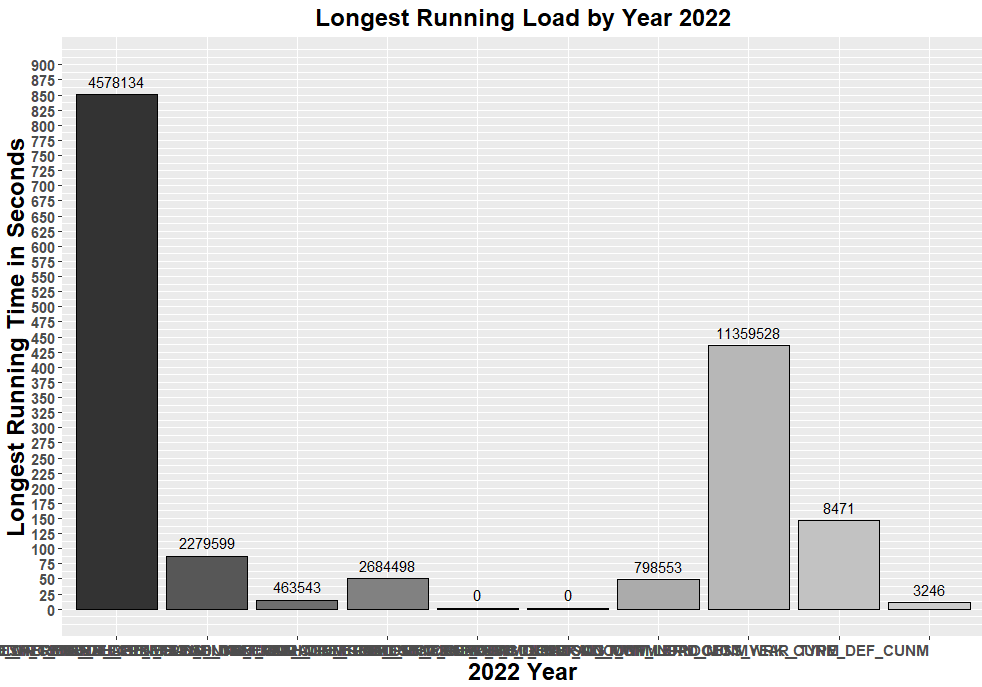
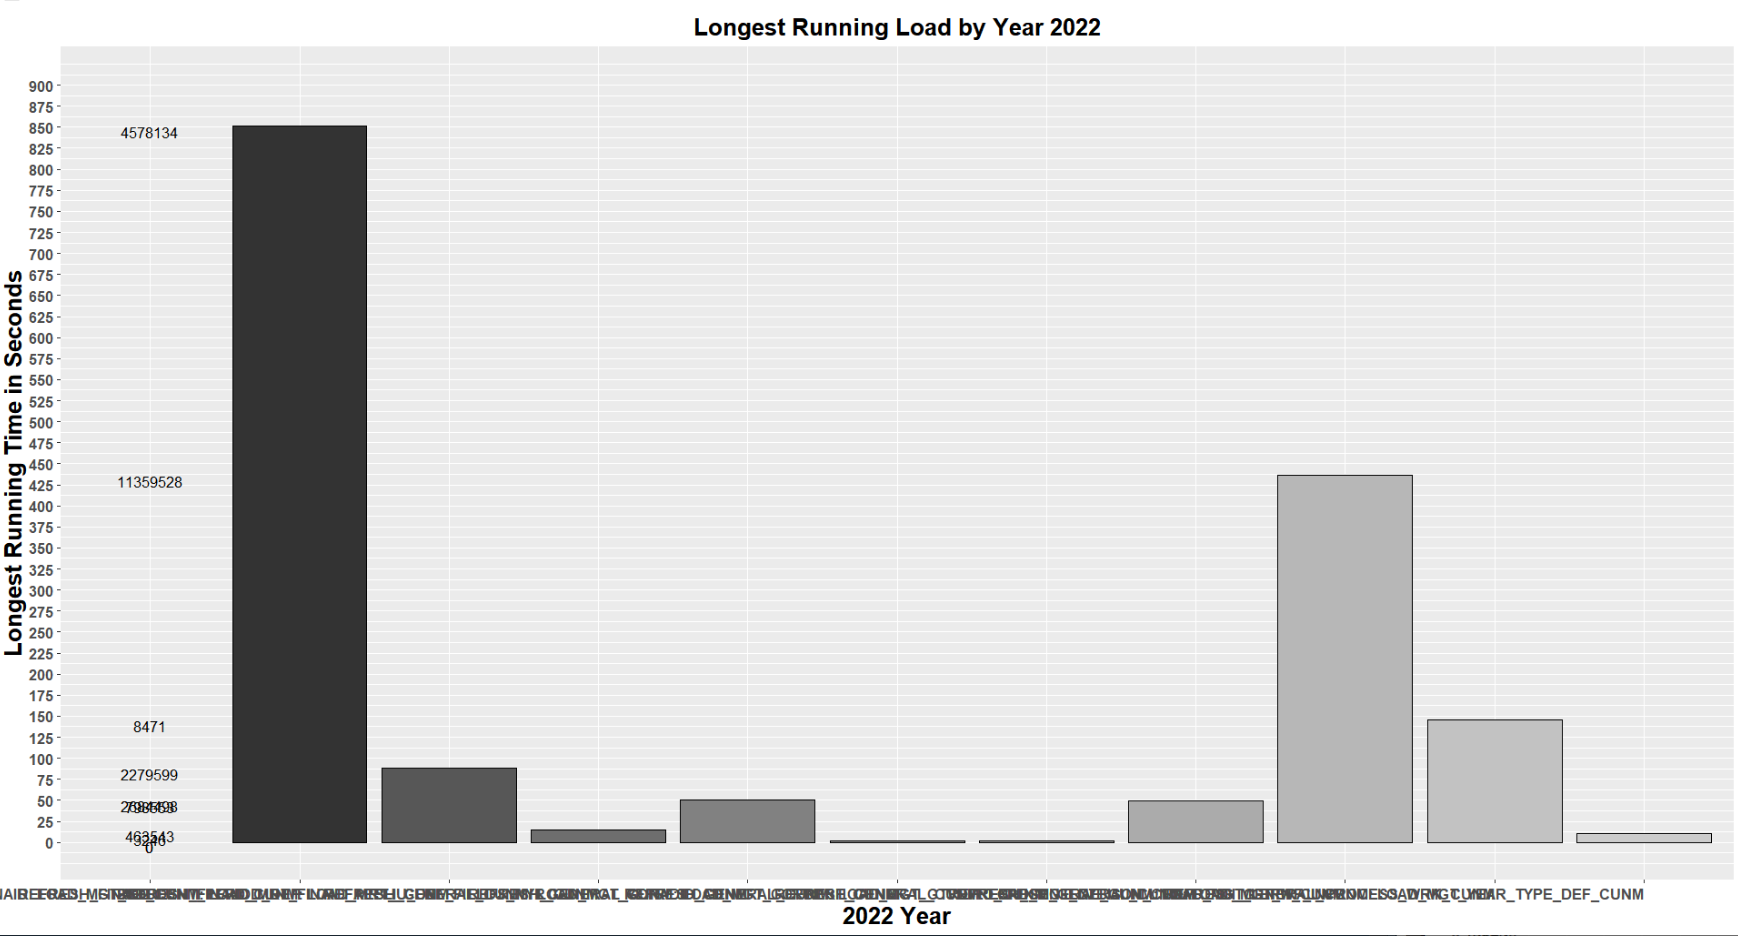
I am trying to place the number inside the bars to represent records that each load processes. I found information online stating that you can do this with geom_text() but I noticed that this is doing something totally different. It is not placing the numbers in their associated loads.
yeargraph <- data_max3 %>%
  group_by(RUN_YEAR) %>%
  ggplot(width = 1, position = position_dodge(0.9)) +
  geom_col(aes(x = Map_Group, y = max_time, fill = Map_Group), position = "dodge", color = "Black") +
  theme(strip.placement = "outside",
        plot.title=element_text(size=18,face="bold", hjust=0.5),
        axis.text=element_text(size=10),
        axis.title.y=element_text(size=18,face="bold"),
        axis.title.x=element_text(size=18,face="bold"),
        axis.text.y = element_text(face="bold",size = 11, hjust = 1),
        axis.text.x = element_text(face="bold",size = 11, hjust = 1),
        legend.position = "none") +
  geom_text(aes( x= RUN_YEAR, y = max_time, label = total_records), color = "black", vjust = 1) +
  labs(x = "2022 Year", y = "Longest Running Time in Seconds") +
  ggtitle("Longest Running Load by Year 2022") +
  scale_y_continuous(limits = c(0,900), breaks = seq(0 ,900, by = 25)) +
  scale_fill_grey()


dput(data_max3)
structure(list(RUN_YEAR = c("2022", "2022", "2022", "2022", "2022",
"2022", "2022", "2022", "2022", "2022"), Map_Group = structure(c(1L,
2L, 3L, 4L, 5L, 6L, 7L, 21L, 22L, 23L), levels = c("REFRESH_FINAID: LOAD_MGT_STUDENT_PERIOD_DEF",
"REFRESH_FINAID_CUNM: LOAD_MRT_FINAID_APPLI_CUNM", "REFRESH_FINAID_CUNM: LOAD_MRT_U_DEF_FIELDS_NYR_CUNM",
"REFRESH_GENERAL_CUNM: LOAD_MGT_GORADID_CUNM", "REFRESH_GENERAL_CUNM: LOAD_MGT_GORDPRF_CUNM",
"REFRESH_GENERAL_CUNM: LOAD_MGT_GTVDIRO_CUNM", "REFRESH_GENERAL_CUNM: LOAD_MGT_GZBISON_CUNM",
"REFRESH_GENERAL_CUNM: LOAD_MGT_LCI_ADGRPS_ALL_CUNM", "REFRESH_GENERAL_CUNM: LOAD_MGT_LCI_ADMIN_CUNM",
"REFRESH_GENERAL_CUNM: LOAD_MGT_LCI_ANS_OFFICES_CUNM", "REFRESH_GENERAL_CUNM: LOAD_MGT_LCI_ANSWERS_COV_CUNM",
"REFRESH_GENERAL_CUNM: LOAD_MGT_LCI_APPT_SLOTS_CUNM", "REFRESH_GENERAL_CUNM: LOAD_MGT_LCI_APPTS_CUNM",
"REFRESH_GENERAL_CUNM: LOAD_MGT_LCI_EVENT_PROF_CUNM", "REFRESH_GENERAL_CUNM: LOAD_MGT_LCI_EVENTS_CUNM",
"REFRESH_GENERAL_CUNM: LOAD_MGT_LCI_LOCATIONS_CUNM", "REFRESH_GENERAL_CUNM: LOAD_MGT_LCI_OFFICES_CUNM",
"REFRESH_GENERAL_CUNM: LOAD_MGT_LCI_QUESTIONS_CUNM", "REFRESH_GENERAL_CUNM: LOAD_MGT_LCI_VISIT_OFFICE_CUNM",
"REFRESH_GENERAL_CUNM: LOAD_MGT_LCI_VISITS_COVID_CUNM", "REFRESH_GENERAL_CUNM: LOAD_MGT_LERN_CUNM",
"REFRESH_GENERAL_CUNM: LOAD_MGT_WF_INPROCESS_WRK_CUNM", "REFRESH_GENERAL_CUNM: LOAD_MGT_YEAR_TYPE_DEF_CUNM",
"REFRESH_GENERAL_CUNM: LOAD_MST_PZBUNMH_ACL_CUNM", "REFRESH_GENERAL_CUNM: LOAD_MST_SPRIDEN_ACL_CUNM",
"REFRESH_STUDENT: LOAD_ACSTUCHG_CUNM", "REFRESH_STUDENT_CUNM: LOAD_MST_COURSE_EQUIV_CUNM",
"REFRESH_STUDENT_CUNM: LOAD_MST_INSTR_DEL_MODE_CUNM", "REFRESH_STUDENT_CUNM: LOAD_MST_SCHED_OFFERING_CUNM",
"REFRESH_STUDENT_CUNM: LOAD_MST_SECFEES_REPEAT_CUNM", "REFRESH_STUDENT_CUNM: LOAD_MST_SZBEXAM_CUNM",
"REFRESH_STUDENT_CUNM: LOAD_MST_SZBWEBA_CUNM", "REFRESH_STUDENT_CUNM: LOAD_MST_SZRANNC_CUNM",
"REFRESH_STUDENT_CUNM: LOAD_MST_SZRGFWF_CUNM", "REFRESH_STUDENT_CUNM: LOAD_MST_SZRHOUS_CUNM",
"REFRESH_STUDENT_CUNM: LOAD_MST_SZRRCRD_CUNM", "REFRESH_STUDENT_CUNM: LOAD_MST_SZRVOTE_CUNM",
"REFRESH_STUDENT_CUNM: LOAD_MST_SZTLAWX_CUNM", "REFRESH_STUDENT_CUNM: LOAD_MST_WAIT_LISTED_CUNM",
"REFRESH_STUDENT_CUNM: LOAD_MST_WEBID_CUNM", "REFRESH_STUDENT_CUNM: LOAD_VZEN_ORIENTATION_CUNM"
), class = "factor"), max_time = c(851, 88, 15, 50, 2, 2, 49,
436, 146, 11), total_records = c(4578134, 2279599, 463543, 2684498,
0, 0, 798553, 11359528, 8471, 3246)), class = c("tbl_df", "tbl",
"data.frame"), row.names = c(NA, -10L))