library(dplyr)
library(lubridate)
library(ggplot2)
# install.packages('openair', dependencies = TRUE)
library(openair)
# get Ozone data for London N. Kensington site
dat <- importAURN(site = "kc1",
data_type = "daily",
pollutant = "o3",
year = 2010:2020)
# create day in the year column
dat <- dat %>%
mutate(jDay = yday(date))
dat
#> # A tibble: 4,018 × 5
#> date o3 site code jDay
#> <dttm> <dbl> <chr> <chr> <dbl>
#> 1 2010-01-01 00:00:00 36.4 London N. Kensington KC1 1
#> 2 2010-01-02 00:00:00 19.6 London N. Kensington KC1 2
#> 3 2010-01-03 00:00:00 19.2 London N. Kensington KC1 3
#> 4 2010-01-04 00:00:00 11.1 London N. Kensington KC1 4
#> 5 2010-01-05 00:00:00 9.17 London N. Kensington KC1 5
#> 6 2010-01-06 00:00:00 22.4 London N. Kensington KC1 6
#> 7 2010-01-07 00:00:00 27.8 London N. Kensington KC1 7
#> 8 2010-01-08 00:00:00 25.7 London N. Kensington KC1 8
#> 9 2010-01-09 00:00:00 49.8 London N. Kensington KC1 9
#> 10 2010-01-10 00:00:00 43.9 London N. Kensington KC1 10
#> # … with 4,008 more rows
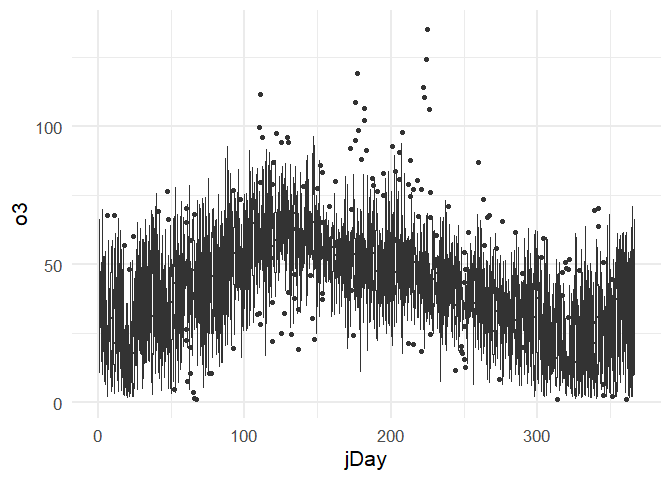
ggplot(data = dat,
aes(x = jDay, y = o3, group = jDay)) +
geom_boxplot() +
theme_minimal(base_size = 16)
#> Warning: Removed 208 rows containing non-finite values (`stat_boxplot()`).
I think wueneed an explanation of the substantive question. I, at least, do not understand what you need.
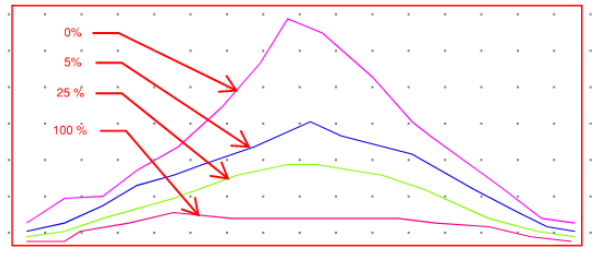
What those lines are representing? We may have a terminology problem. To me a percentile is a number that can be interpreted along the lines of "A percentile of 60% means that 6o% of the values in the data set are below than number. See Percentiles
If I am reading the code below correctly,
dat <- dat %>%
  mutate(jDay = yday(date))

ggplot(data = dat,
       aes(x = jDay, y = o3, group = jDay)) +
  geom_boxplot() +
  theme_minimal(base_size = 16)
is asking for a boxplot for every day of the year for 10 years so, I think that means you are asking for 366 boxplots . Each will only have 10 data points except for Feb 29 which will have two .
library(tidyverse)
library(openair)
# get Ozone data for London N. Kensington site
dat <- importAURN(site = "kc1",
data_type = "daily",
pollutant = "o3",
year = 2010:2020)
# create day in the year column
dat <- dat %>%
mutate(jDay = yday(date))
dat
qs <- c(0,0.05,.25,1)
# the quantile method itself is capable of outputting results for each quantile requested
(qdf_option_a <- group_by(
dat,
jDay
) |>
summarise(across(
.cols = o3,
.fns = \(x)
as.data.frame(rbind(quantile(x, probs = qs,na.rm=TRUE)))
,.unpack = TRUE))|> pivot_longer(-jDay) |> mutate(name=as_factor(name)))
# Begin alternative to make quantile data frame #
# if you had to use quantile multiple times each time to get a different quantile
# you might do ...
# prep qdf_option_b
qfuncs <- lapply(qs, \(q){
function(x) {
quantile(x,
probs = q, na.rm = TRUE
)
}
}) |>
setNames(paste0("q_", qs))
(qdf_option_b <- group_by(
dat,
jDay
) |>
summarise(across(
.cols = o3,
.fns = qfuncs
)) |>
pivot_longer(cols = -jDay) |> mutate(name=as_factor(name)))
# END DATA PREP
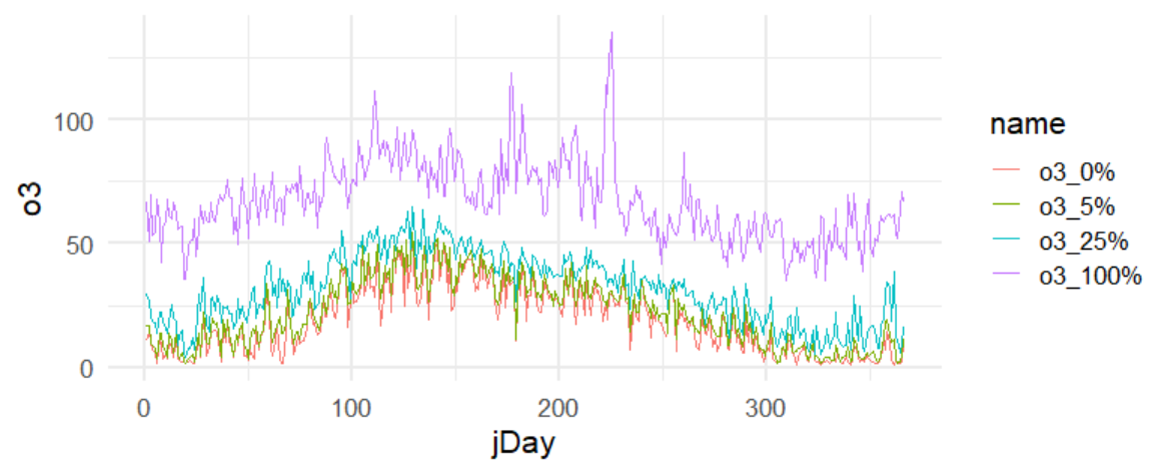
ggplot(data = dat,
aes(x = jDay, y = o3)) +
# geom_point(alpha=.05)+
theme_minimal(base_size = 16)+
geom_line(data=qdf_option_a,
mapping = aes(y=value,color=name))