nbaes
February 21, 2023, 11:57am
1
I have attempted to do so by the last line of code in the gpplot below, however I get an error!
cultnature_fig <- culture_nature_long |>
  ggplot(mapping = aes(x = epoch, y = rel_freq,
                         group = Concept)) +
  geom_line(aes(linetype = Concept)) +
  theme_classic() +
  labs(x = "Epoch", y = "Relative Frequency") +
  theme(axis.text.x = element_text(angle = 45, hjust = 1)) +
  theme(legend.position = c(0.18,0.80)) +
  scale_y_continuous(labels = scales::comma)
print(cultnature_fig)
Error: Discrete value supplied to continuous scale
I have also tried to use the below at the top of my script but it doesn't alter the scientific notation in the data frame or the ggplot.
options(scipen = 999) # to eliminate scientific notation in numbers and charts
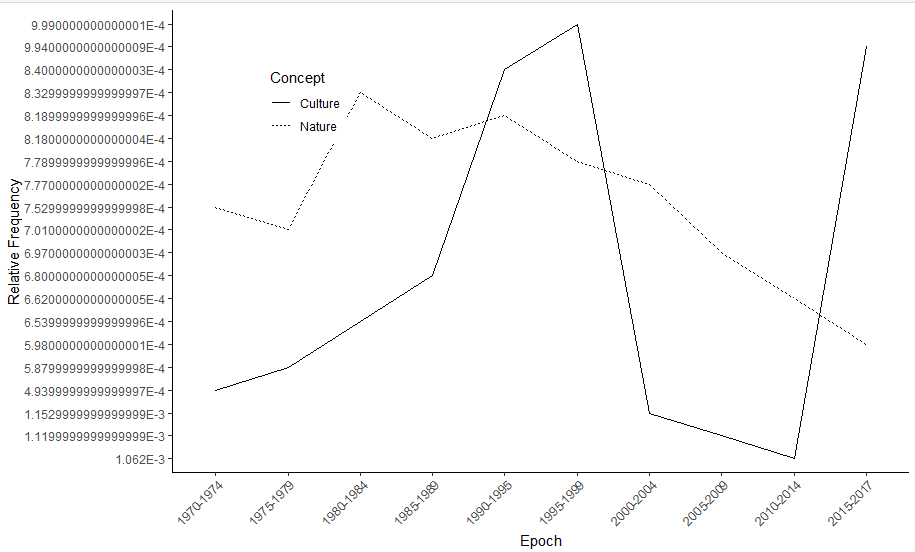
Figure without attempted removal of sci notation:
nbaes:
scale_y_continuous
I am just guessing without any data but maybe try
scale_y_discrete
A handy way to supply some sample data is the dput() function. In the case of a large dataset something like dput(head(mydata, 100)) should supply the data we need. Just do dput(mydata) where mydata is your data. Copy the output and paste it here.
1 Like
You could make this in aes( y). For avoid many numbers
ggplot(mapping = aes(x = epoch, y = rel_freq/100000,
                         group = Concept))
1 Like
nbaes:
rel_freq
you should cast your character representation of numbers to be actual numeric type, before initiating the chart.
culture_nature_long$rel_freq <- as.numeric(culture_nature_long$rel_freq )
1 Like
nbaes
February 27, 2023, 12:39am
5
Thank you to everyone's responses! This is exactly what I was looking for. I am guessing that R was reading the values in the column as character due to the scientific notation?
system
March 6, 2023, 12:39am
6
This topic was automatically closed 7 days after the last reply. New replies are no longer allowed.