I want to remove the highlighted rows from this table.
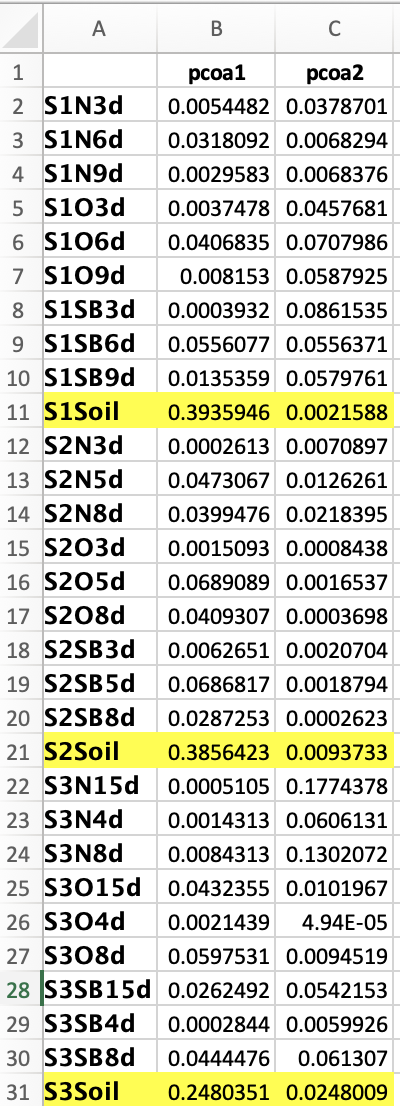
The dput() function gives the structure of the above table as follows:
dput(positions)
structure(c(0.00544815711950608, 0.031809183872217, 0.00295833511471403,
0.00374776439028969, 0.0406834693528516, 0.00815303078791478,
0.000393196597238439, 0.0556077406563358, 0.0135358584655523,
0.393594562892309, 0.000261315911127579, 0.0473067433010633,
0.0399476142772836, 0.00150934217479202, 0.0689089102195301,
0.0409307485498064, 0.00626512315885165, 0.0686817396158806,
0.0287252946138909, 0.385642271602795, 0.000510499942869509,
0.00143129350821356, 0.00843131036731882, 0.0432354652231734,
0.00214390223027345, 0.0597531338407985, 0.0262492357181321,
0.000284430756786979, 0.0444476243642517, 0.248035137151755,
0.0378701469305432, 0.00682942321690139, 0.00683760428946566,
0.0457680543575575, 0.0707986166210382, 0.0587925204457527, 0.0861534801529267,
0.0556371061876673, 0.0579761256652328, 0.00215878224919294,
0.00708970066439689, 0.0126261153031024, 0.0218394602622643,
0.000843812262323225, 0.00165365084025309, 0.000369775724521361,
0.00207044146601326, 0.00187935871642063, 0.000262349796480839,
0.00937333035205324, 0.17743775322607, 0.0606131301690102, 0.130207241853574,
0.0101967287727652, 4.94035708645193e-05, 0.00945189617232762,
0.0542152950748867, 0.00599259625208367, 0.0613069798692429,
0.0248009340857729), dim = c(30L, 2L), dimnames = list(c("S1N3d",
"S1N6d", "S1N9d", "S1O3d", "S1O6d", "S1O9d", "S1SB3d", "S1SB6d",
"S1SB9d", "S1Soil", "S2N3d", "S2N5d", "S2N8d", "S2O3d", "S2O5d",
"S2O8d", "S2SB3d", "S2SB5d", "S2SB8d", "S2Soil", "S3N15d", "S3N4d",
"S3N8d", "S3O15d", "S3O4d", "S3O8d", "S3SB15d", "S3SB4d", "S3SB8d",
"S3Soil"), c("pcoa1", "pcoa2")))
How can i modify this structure to omit those three highlighted rows only. I also want to remove these from dimnames list as well.
Regards
HIRA