JeffF
March 2, 2023, 3:47am
1
Drawing blank here. I would like a chart with three bars for the three types with each bar being a sum of the total of each type. A should be 27; B, 36; and C, 11.
My data and attempt:
library(tidyverse)

type <- c("A", "A", "A", "A", "B", "B", "B", "B", "B", "B", "C", "C")
quant <- c("2", "9", "5", "11", "2", "9", "12", "2", "6", "5", "5", "6")

dat <- data.frame(type, quant)

ggplot(dat, aes(y=type)) + geom_bar()
Thanks,
FJCC
March 2, 2023, 4:13am
2
I find it easiest to summarize the data before passing it to ggplot(). Also, putting quotes around numeric values adds the extra step of converting them to numbers, so I deleted the quotes.
library(ggplot2)
library(dplyr)
type <- c("A", "A", "A", "A", "B", "B", "B", "B", "B", "B", "C", "C")
quant <- c(2, 9, 5, 11, 2, 9, 12, 2, 6, 5, 5, 6)
dat <- data.frame(type, quant)
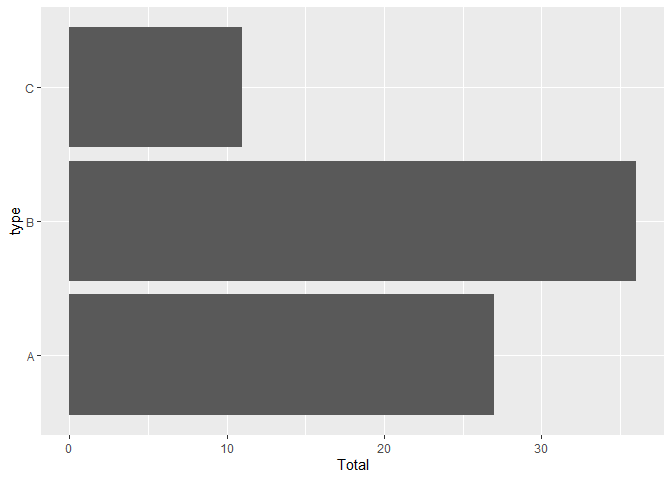
dat |> group_by(type) |> summarize(Total = sum(quant)) |>
ggplot(aes(x = Total, y=type)) + geom_col()
Created on 2023-03-01 with reprex v2.0.2
1 Like
You need calculate the sum and next make the plot
type <- c("A", "A", "A", "A", "B", "B", "B", "B", "B", "B", "C", "C")
quant <- c("2", "9", "5", "11", "2", "9", "12", "2", "6", "5", "5", "6")
dat <- data.frame(type, quant)
# Convert quant to numeric
dat$quant <- as.numeric(dat$quant)
# Calculate the total for each type
total <- aggregate(dat$quant, by=list(dat$type), FUN=sum)
# Set column names
colnames(total) <- c("type", "total")
# Create bar plot
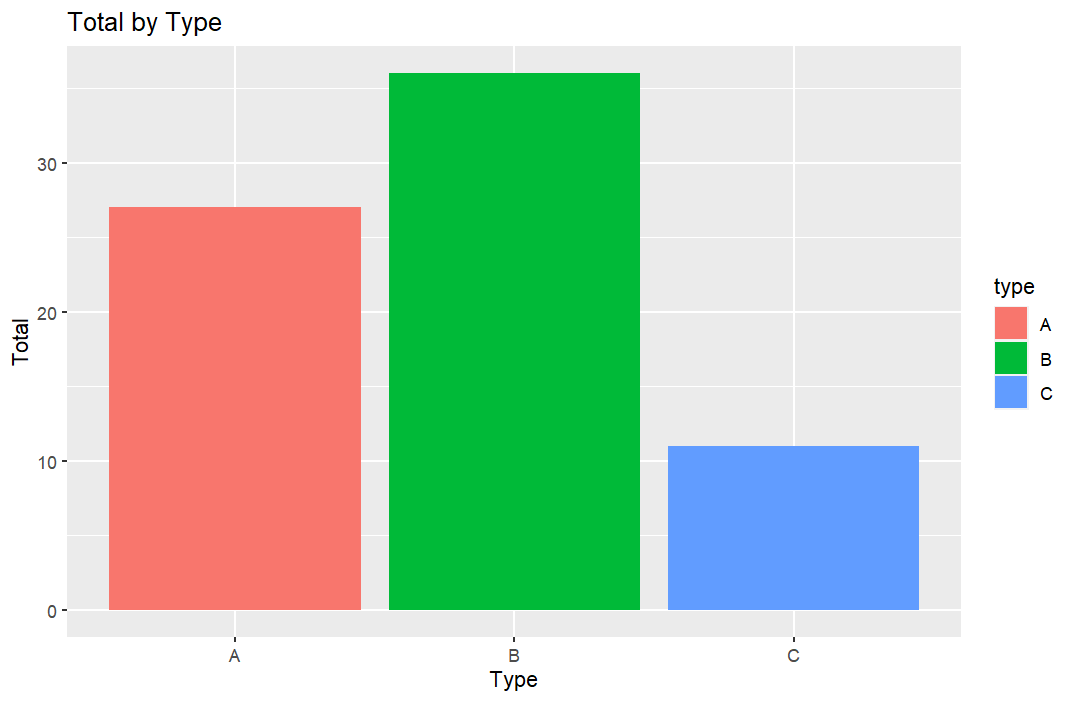
ggplot(total, aes(x=type, y=total, fill=type)) +
geom_bar(stat="identity") +
labs(title="Total by Type", x="Type", y="Total")
1 Like
system
March 9, 2023, 4:19am
4
This topic was automatically closed 7 days after the last reply. New replies are no longer allowed.