How to visualize the percent distribution?

Hello
I have a data sheet and want to find out the percent distribution.


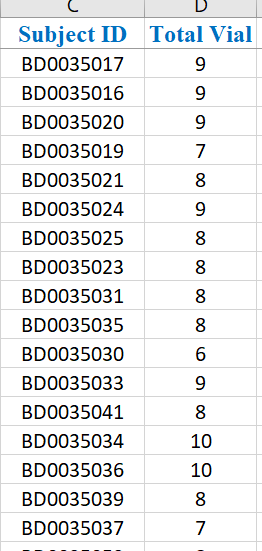
This is the sample data and I have a large number of data in this format. I want to find the percentage of the vial number. There are lots of duplications in the vial number.
for example, I want to find the percentage of having vial numbers 8 or 9, or 10, etc.
How can I do that?
Thanks.

This is old-fashioned and a bit ugly but I think it works. Note I have changed the variable names.

library(ggplot2)
dat1 <- structure(list(id = c("BD0035017", "BD0035016", "BD0035020", 
                              "BD0035019", "BDO035021", "BD0035024", "BDO035025", "BD0035023", 
                              "BDO035031", "BD0035035", "BD0035030", "BD0035033", "BD0035041", 
                              "BD0035034", "BD0035036", "BD0035039", "BD0035037"), vial = c(9L, 
                              9L, 9L, 7L, 8L, 9L, 8L, 8L, 8L, 8L, 6L, 9L, 8L, 10L, 10L, 8L, 
                              7L)), row.names = c(NA, 17L), class = "data.frame") 

dat1$vial <- as.character(dat1$vial)
tt1 <- table(dat1$vial)
tt2 <- as.data.frame(tt1)
tt2$pc <- tt2$Freq/sum(tt2$Freq) * 100 


ggplot(tt2, aes(Var1, pc)) + geom_bar(stat = "identity", aes(fill = "red"), show.legend = FALSE) +
  xlab("Vial ID") + ylab("Percentage")

1 Like

BTW, screenshots are not usually a good idea. It is better to provide a sample of your actual data.

A handy way to supply some sample data is the dput() function. In the case of a large dataset something like dput(head(mydata, 100)) should supply the data we need. Just do dput(mydata) where mydata is your data. Then copy the output and paste it here.

It was really helpful. Thank you very much @jrkrideau

I will keep in mind that. Thanks.

This topic was automatically closed 42 days after the last reply. New replies are no longer allowed.

If you have a query related to it or one of the replies, start a new topic and refer back with a link.