library(shiny)
library(DT)

df <- data.frame(
  row.names = c("A", "B", "C", "D"),
  `A` = c(NA, NA, NA, NA),
  `B` = c("EXTREMELY LOW", NA, NA, NA),
  `C` = c("MODERATE", "EXTREMELY LOW", NA, NA),
  `D` = c("MODERATE", "EXTREMELY LOW", "VERY LOW", NA)
)

df1 <- data.frame(
  row.names = c("A", "B", "C", "D"),
  `A` = c(NA, NA, NA, NA),
  `B` = c("5 (-2,9)", NA, NA, NA),
  `C` = c("4 (-5,6)", "8 (6,20)", NA, NA),
  `D` = c("10 (4,15)", "6 (-2,9)", "7 (-1,10)", NA)
)

ui <- fluidPage(
  titlePanel("Data Table with Color-Coded Values"),
  sidebarLayout(
    sidebarPanel(),
    mainPanel(
      DTOutput("table")
    )
  )
)

server <- function(input, output) {
  output$table <- renderDT(
    data.table(merge(df, df1, by = "row.names")),
    options = list(
      iDisplayLength = 25,
      autoWidth = TRUE,
      columnDefs = list(
        list(targets = "_all", className = "dt-center",width = '200px')
      ),
      scrollX = TRUE
    )
  ) %>%
    formatStyle(
      2:ncol(df1),
      color = styleEqual(
        c(NA, 'EXTREMELY LOW', 'VERY LOW', 'LOW', 'MODERATE', 'HIGH'),
        c('white', 'red', '#F633FF', "#6B33FF", 'gold', "green")
      )
    )
}


shinyApp(ui = ui, server = server)
You'll need to add: library(data.table) to make this run.
Then data.table(merge(df, df1, by = "row.names")) bit in output$table would create:
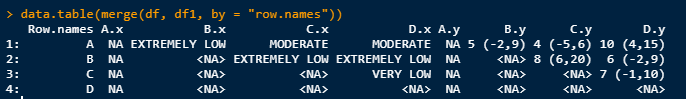
Which is probably not the desired output. What should it be?
Yes that is not the desired output. I wanted the only df1 to be the output where it should be coloured based on the texts in df. Thus "5 (-2,9)" should be red as its corresponding entry in df is "Extremely Low", "4 (-5,6)" should be gold as its corresponding entry in df is "Moderate, and so on... Thanks for the initial reply.
This topic was automatically closed 21 days after the last reply. New replies are no longer allowed.
If you have a query related to it or one of the replies, start a new topic and refer back with a link.