Cat22Table <- data.frame(
Hvernig = c("Gamladags", "Stapnadur", "Spilltan", "Mengandi", "Skapar verdmaeti fyrir faa", "Lagt menntunarstig"),
"1-2" = c(19., 15.9, 55.8, 31.2, 51.9, 13.6),
"3-5" = c(46.4, 56.0, 35.5, 59.2, 35.5, 71.9),
"6-7" = c(34.6, 28.1, 8.7, 9.6, 12.6, 14.5)
)
Cat22Visual <- Cat22Table %>%
ggplot(
Data = Cat22Table,
aes(y = Hvernig),
position_stack(1),
) +
geom_bar(
aes(
weight = X1.2,
fill = "1-2"
),
alpha = 1
) +
geom_bar(
aes(
weight = X3.5,
fill = "3-5"
),
alpha = 1
) +
geom_bar(
aes(
weight = X6.7,
fill = "6-7"
),
alpha = 1,
) +
labs(
title = "Hvernig metur þú orðapör?",
subtitle = "(percent)",
x = "percent",
fill= "Response")
Cat22Visual
FJCC
2
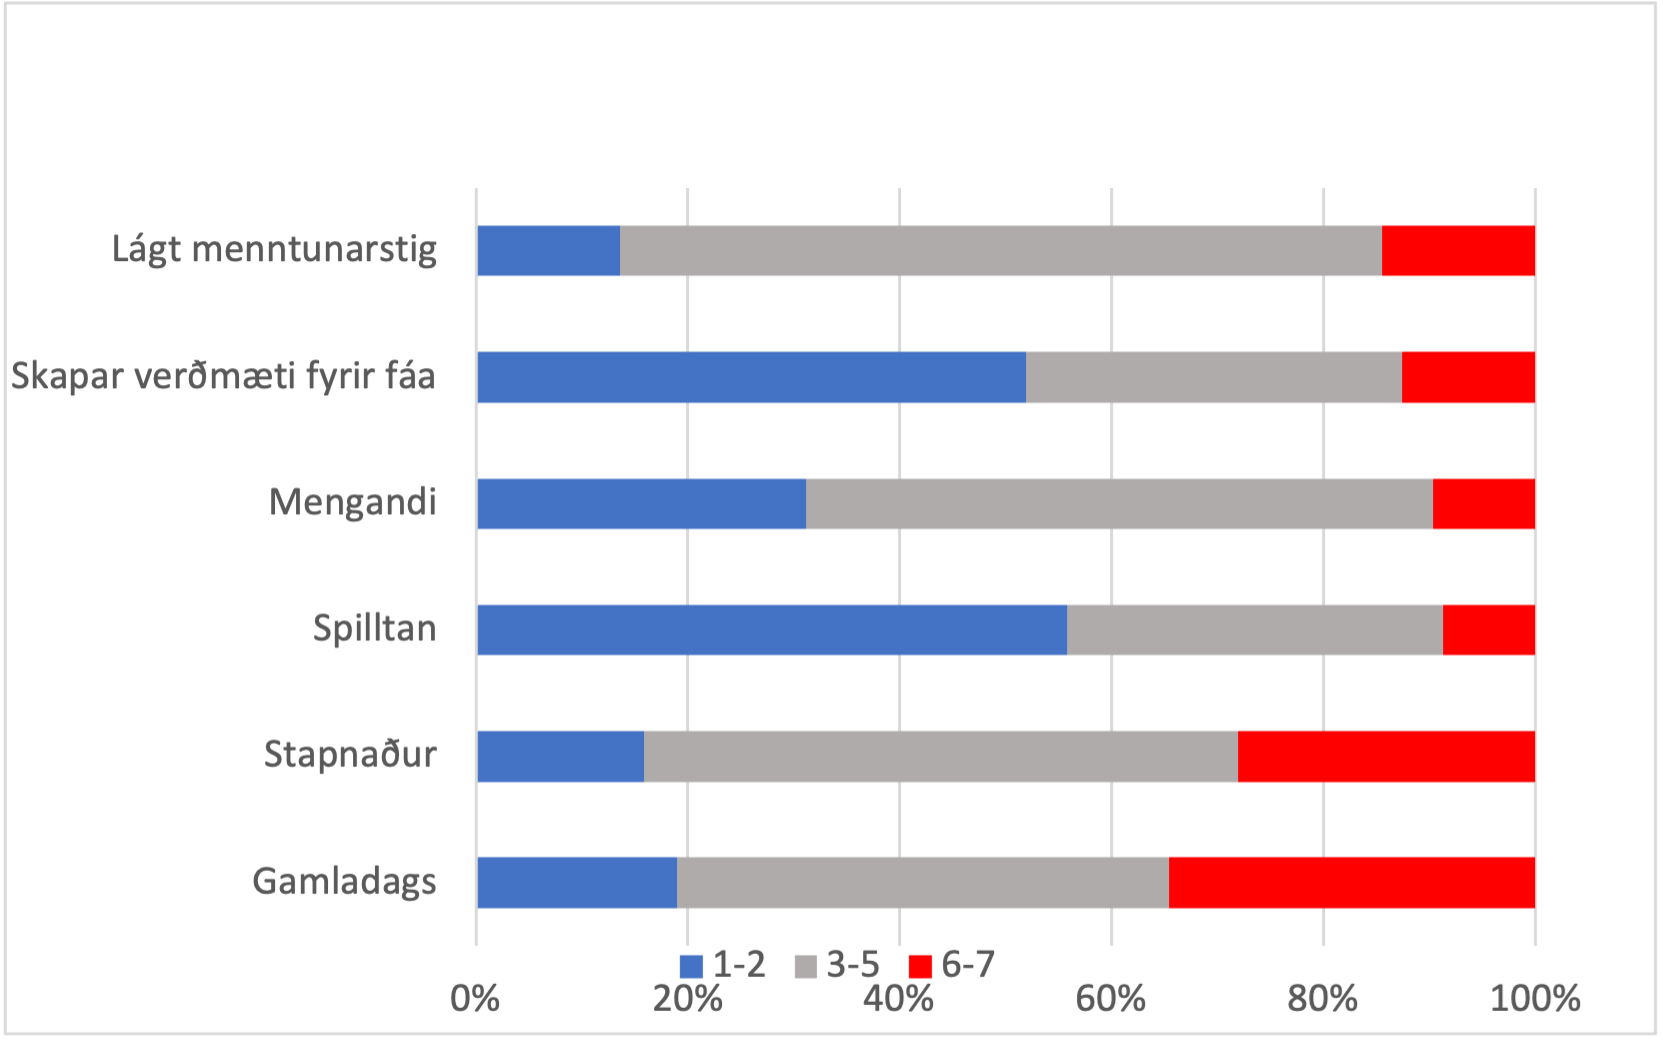
Is this the kind of plot you want to make?
Cat22Table <- data.frame(
  Hvernig = c("Gamladags", "Stapnadur", "Spilltan", "Mengandi", "Skapar verdmaeti fyrir faa", "Lagt menntunarstig"),
  "1-2" = c(19., 15.9, 55.8, 31.2, 51.9, 13.6),
  "3-5" = c(46.4, 56.0, 35.5, 59.2, 35.5, 71.9),
  "6-7" = c(34.6, 28.1, 8.7, 9.6, 12.6, 14.5)
)
library(tidyr)
library(ggplot2)
LongDF <- pivot_longer(Cat22Table, cols = starts_with("X"),
                       names_to = "Percent", values_to = "Value")

LongDF
#> # A tibble: 18 × 3
#>    Hvernig                    Percent Value
#>    <chr>                      <chr>   <dbl>
#>  1 Gamladags                  X1.2     19
#>  2 Gamladags                  X3.5     46.4
#>  3 Gamladags                  X6.7     34.6
#>  4 Stapnadur                  X1.2     15.9
#>  5 Stapnadur                  X3.5     56
#>  6 Stapnadur                  X6.7     28.1
#>  7 Spilltan                   X1.2     55.8
#>  8 Spilltan                   X3.5     35.5
#>  9 Spilltan                   X6.7      8.7
#> 10 Mengandi                   X1.2     31.2
#> 11 Mengandi                   X3.5     59.2
#> 12 Mengandi                   X6.7      9.6
#> 13 Skapar verdmaeti fyrir faa X1.2     51.9
#> 14 Skapar verdmaeti fyrir faa X3.5     35.5
#> 15 Skapar verdmaeti fyrir faa X6.7     12.6
#> 16 Lagt menntunarstig         X1.2     13.6
#> 17 Lagt menntunarstig         X3.5     71.9
#> 18 Lagt menntunarstig         X6.7     14.5
ggplot(LongDF, aes(y = Hvernig, x = Value, fill = Percent)) +
  geom_col(position = "dodge") +
  theme(axis.text.x = element_text(angle = 90, vjust = 0.5))
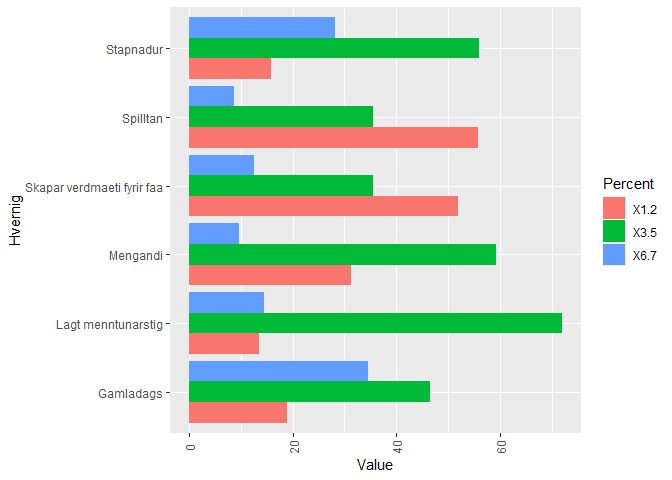
Created on 2023-05-03 with reprex v2.0.2
1 Like
Hi- this is close, but I want the bars next to each other, so it looks like this.
I got it by changing dodge to stack. Thank you so much for your help with this.
system
Closed
5
This topic was automatically closed 7 days after the last reply. New replies are no longer allowed.
If you have a query related to it or one of the replies, start a new topic and refer back with a link.