The code
EstFund_LT <- read.csv("C:\Users\Samridhi\Desktop\New folder\Lithuania Building Prices.csv", sep= ";")
EstFund_LT
EstFund_LT_TS <- ts(EstFund_LT, frequency = 4, start=c(2016,1))
EstFund_LT_TS
plot.ts(EstFund_LT_TS, aes(x = date, y = price_index, group = T)) +
geom_line() +
scale_x_date(
date_breaks = '3 months',
label = date_format(format = '%m-%Y'))
The data
EstFund_LT
DATE Price.index
1 2016-01-01 111.0524
2 2016-04-01 113.2230
3 2016-07-01 117.9778
4 2016-10-01 118.7229
5 2017-01-01 119.0881
6 2017-04-01 120.5646
7 2017-07-01 122.7022
8 2017-10-01 121.7658
9 2018-01-01 124.1870
10 2018-04-01 126.1828
11 2018-07-01 127.7915
12 2018-10-01 127.6438
13 2019-01-01 131.1385
14 2019-04-01 131.0206
15 2019-07-01 132.7060
16 2019-10-01 133.2458
17 2020-01-01 135.9200
18 2020-04-01 139.0751
19 2020-07-01 139.7961
20 2020-10-01 145.0123
21 2021-01-01 150.9321
22 2021-04-01 152.6017
23 2021-07-01 157.6510
24 2021-10-01 159.0404
EstFund_LT_TS
DATE Price.index
2016 Q1 1 111.0524
2016 Q2 2 113.2230
2016 Q3 3 117.9778
2016 Q4 4 118.7229
2017 Q1 5 119.0881
2017 Q2 6 120.5646
2017 Q3 7 122.7022
2017 Q4 8 121.7658
2018 Q1 9 124.1870
2018 Q2 10 126.1828
2018 Q3 11 127.7915
2018 Q4 12 127.6438
2019 Q1 13 131.1385
2019 Q2 14 131.0206
2019 Q3 15 132.7060
2019 Q4 16 133.2458
2020 Q1 17 135.9200
2020 Q2 18 139.0751
2020 Q3 19 139.7961
2020 Q4 20 145.0123
2021 Q1 21 150.9321
2021 Q2 22 152.6017
2021 Q3 23 157.6510
2021 Q4 24 159.0404
The Time series is splitting date and including month and year on x axis and date on y axis.
The plot
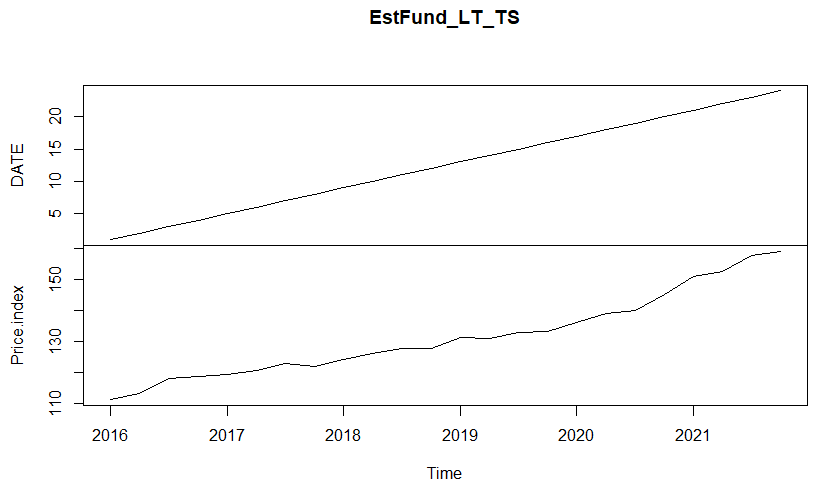
I want to fix the data.frame and plot and have date on x axis properly and price index on y axis.