I still don't entirely know my way around the modelling in R, so I might be approaching this in completely the wrong way. I'm trying to fit a model to some data that should initially increase linearly, then at some value, a, it should flatten out. This switch should be quite sharp.
Is there a way to include an ifelse() or similar statement in a formula? In my testing below I have been able to make it kind of work, but not to be able to find the point at which the value will flatten.
Should I be approaching this a completely different way? Is this a silly idea? Any help would be appreciated!
library(ggplot2)
dat <- data.frame(
x = c(1:10),
y = c(1:4, rep(4, 6) + rnorm(6, sd = 0.1))
)
cutoff <- function(x, a = 4) {
ifelse(x > a, a, x)
}
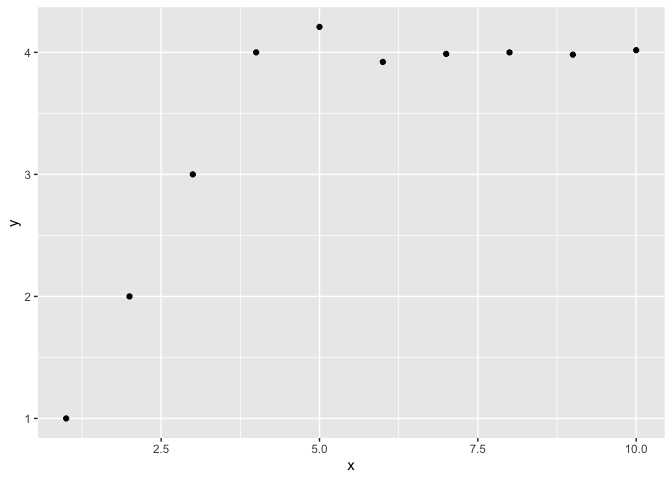
plt <- ggplot(dat, aes(x, y)) +
geom_point()
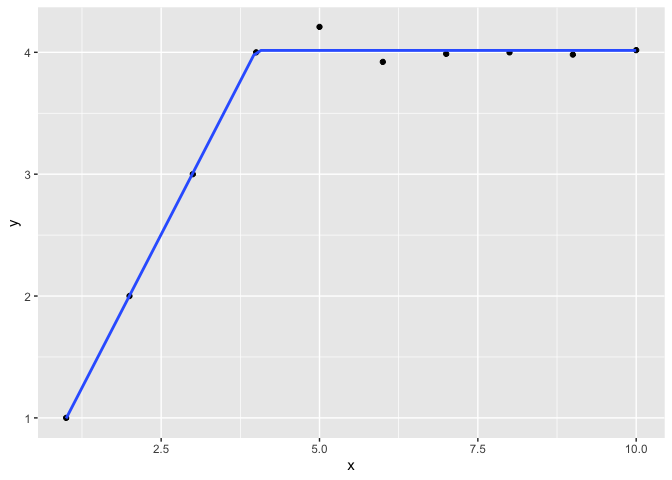
plt +
geom_smooth(
method = 'lm',
formula = y ~ cutoff(x),
se = FALSE
)
plt +
  geom_smooth(
    method = 'lm',
    formula = y ~ cutoff(x, a),
    se = FALSE
  )
#> Warning: Computation failed in `stat_smooth()`:
#> object 'a' not found
actually, your approach seems ok to me.
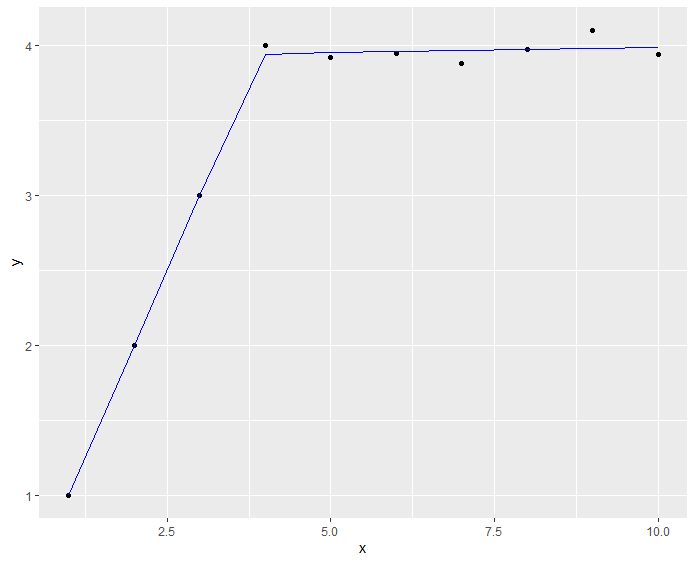
If I am sure about my data will have the behavior " initially increase linearly, then at some value, a , it should flatten out", then we find the local maxima, then split data into two subsets, and fit two different models to values before local max, and after local max.
to find the point at which the value will flatten (local maxima), one may use the slope of the line.
here is my code to find local maxima and fit lines 2 subsets.
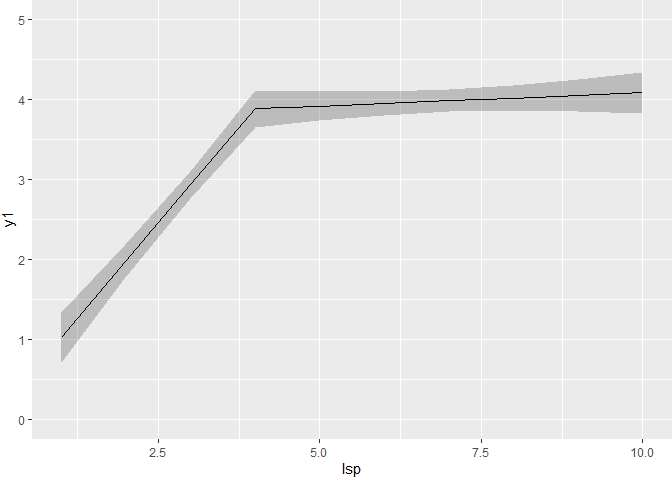
We also have the brokenstick R package that can accommodate longitudinal data, and in rms you have the lsp with known knots or rcs to estimate the knots location:
library(rms)
#> Loading required package: Hmisc
#> Loading required package: lattice
#> Loading required package: survival
#> Loading required package: Formula
#> Loading required package: ggplot2
#>
#> Attaching package: 'Hmisc'
#> The following objects are masked from 'package:base':
#>
#>     format.pval, units
#> Loading required package: SparseM
#>
#> Attaching package: 'SparseM'
#> The following object is masked from 'package:base':
#>
#>     backsolve
set.seed(134564)
dat <- data.frame(
  x1 = c(1:10),
  y1 = c(1:4, rep(4, 6) + rnorm(6, sd = 0.1))
)

options(datadist="d")
d <- datadist(dat)


m1 <- ols(y1~x1, data=dat)
m2 <- ols(y1~rcs(x1,3,label="rcs"), data=dat)
m3 <- ols(y1~lsp(x1,4,label="lsp"), data=dat)
ggplot(Predict(m3))