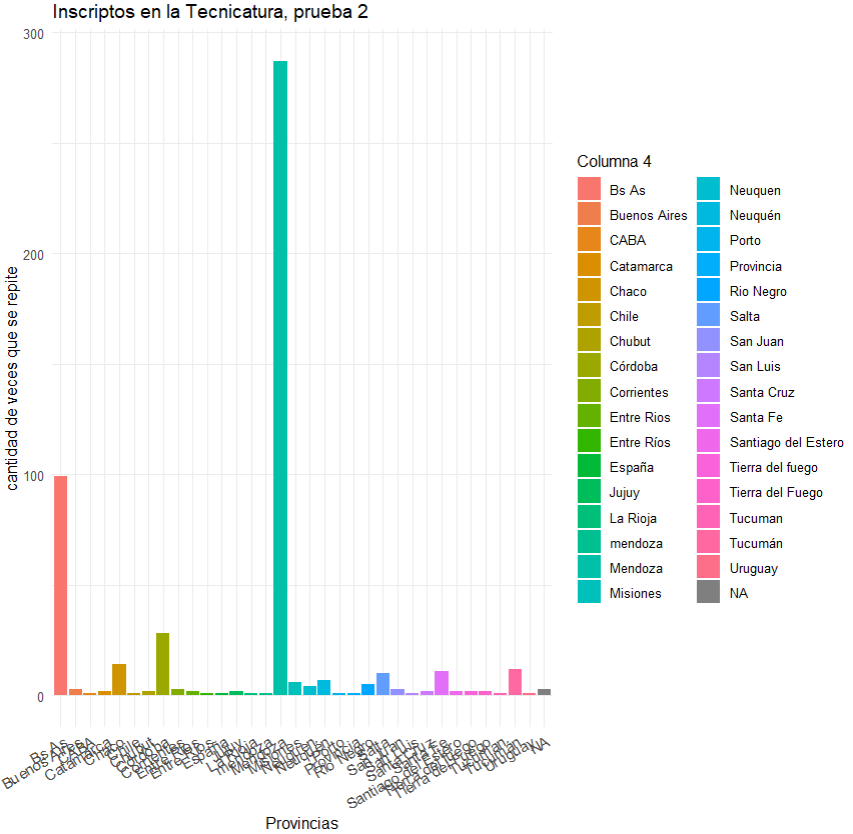
I want to paint with color, only 2 bars. The highest one (cyan color), and the one that follows (the salmon-red one), and turn the rest into gray colors... Is this possible in RStudio with Ggplot2?...
And lastly.... Is it possible to write the name of the highest variable on the cyan bar? to express which name is the highest?
I would suggest a horizontal bar plot, which will allow the province names to be readable on the vertical axis. That would also eliminate the need for a legend. Finally, alphabetical order is probably not the best. How about from highest to lowest? You can use the gghighlight package to color only the bars with values greater than some value, such as 90.
See section 6.1 of Claus Wilke's book, Fundamentals of Data Visualization
You can create a dummy variable to identify which Provincia you want to highlight and map the fill aesthetic to that variable. To give you specific code, Can you provide a proper REPRoducible EXample (reprex) illustrating your issue?
In addition to the other suggestions (which are great), I'd recommend checking out the gghighlight package for this, which allows you to highlight a geom based on a predicate (e.g. you could say to highlight the values whoch are over, say 50, for the two that you point out in this case)
Or, if you're looking for the top two, you can use non-logical predicates to say you want the x number of highest of a certain variable to be highlighted. From the docs linked above:
gghighlight() allows predicates that return non-logical (e.g. numeric and character) results. The values are used for sorting data and the top max_highlight of rows/groups are highlighted: