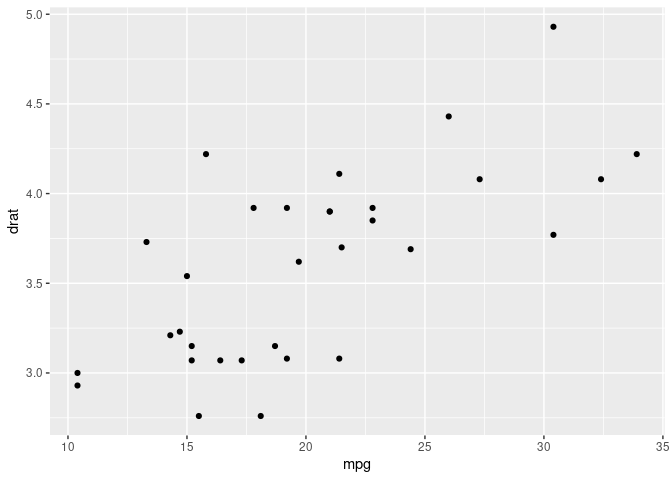
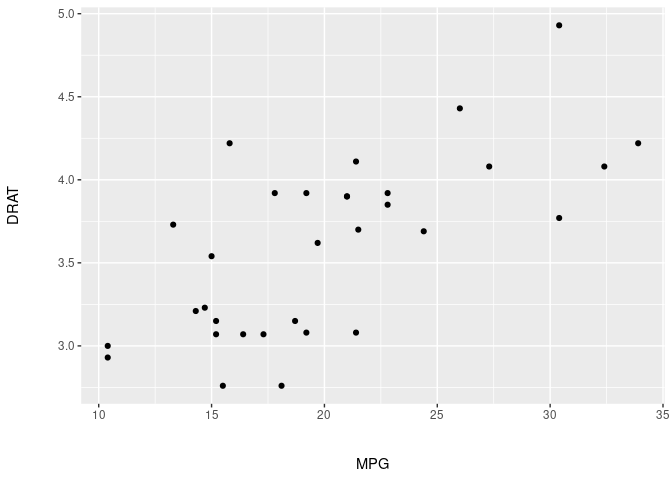
How do I increase the space between ylab and the plot and xlab and the plot?
parallel_plot <- eigendf %>% ggplot(aes(x = num, y = eigenvalue, shape = type)) +
  geom_line() + # Add lines connecting data points
  geom_point(size = 4.5) + # Add the data points.
  ylab('Eigenvalue') + # Label the y-axis 'Eigenvalue'
  xlab('Number of Components') +
  scale_x_continuous(breaks=min(eigendf$num):max(eigendf$num)) +
  scale_y_continuous(limits=c(0.5, 1.5)) +
  theme(axis.text.x = element_text(hjust = -10)) + # more horizontal spacing
  scale_shape_manual(values=c(19,21)) + # Manually specify the different shapes to use for actual+simulated data
  geom_vline(xintercept = parallel$ncomp, linetype = 'dashed') + # add vertical line parallel analysis suggested max # of factors to retain
  apatheme # Apply APA-formatting theme
show(parallel_plot)
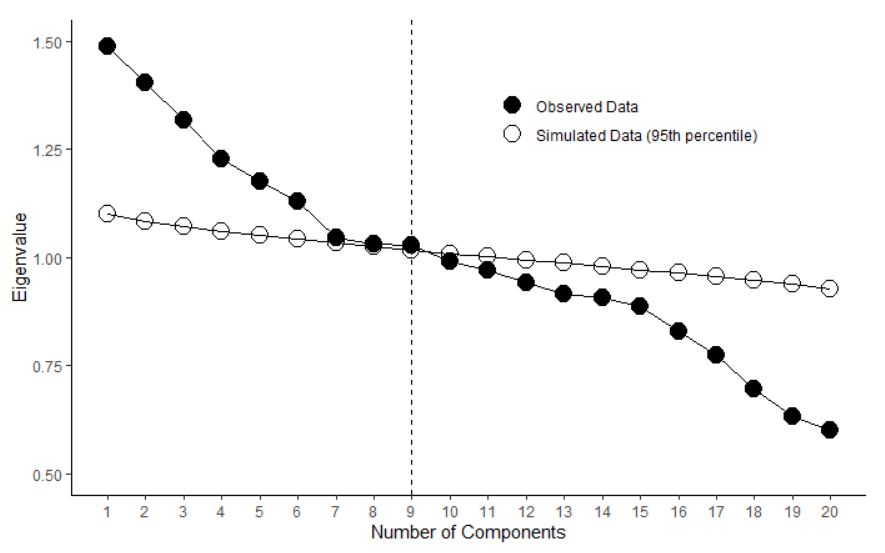
I am trying to mimick the spacing in this plot (not computed in R)