Hi everybody,
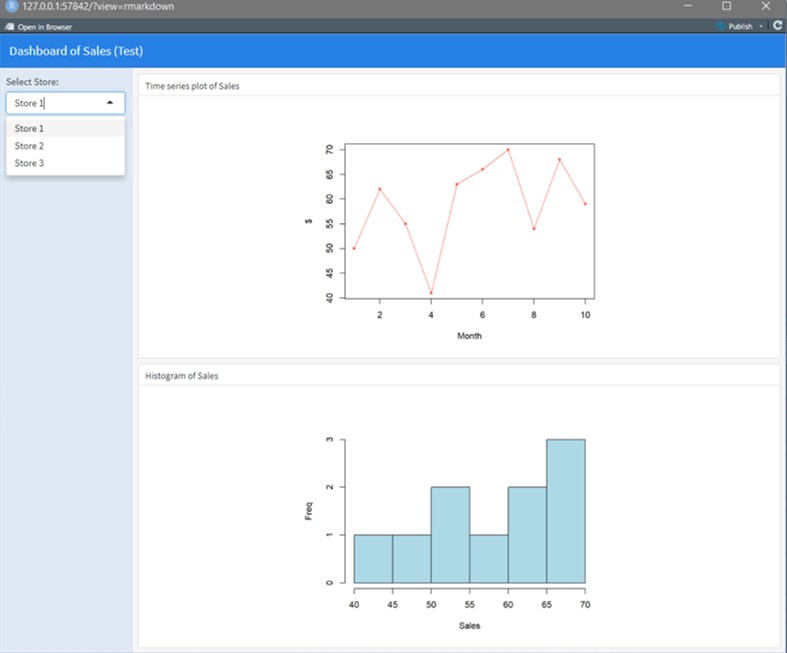
I'd like to know how to make a simple interative dashboard just to show plots for different stores for example.
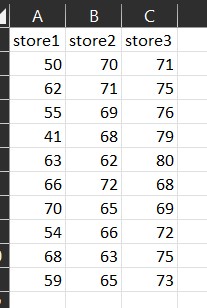
Suppose I have 3 stores and I want to show in the same dashboard some information thru plots reading an Excel file with 3 columns (3 stores).
I just want to understand how to select "store 1" and the plots of "store 1" are showed. If I select the "store 2" tha plots of "store 2" are showed and so on.
See picture of my "dashboard".
Of course in this way my dashboard is not interactive.
I have already tried to write some code based on examples but it didn't work well and I had a lot of errors and misunderstantings.
Some tips will be appreciate.
Thank you.
my script
---
title: "Dashboard of Sales (Test)"
output:
  flexdashboard::flex_dashboard:
    orientation: columns
    vertical_layout: fill
runtime: shiny
---
#```{r setup, include=FALSE}
#library(flexdashboard)
#library(readxl)
#```
#```{r data}
#sales <- read_xlsx("store_sales.xlsx")
#stores_number = c("Store 1", "Store 2", "Store 3")
#```
#Column {.sidebar data-width=200}
#-----------------------------------------------------------------------
#```{r}
#selectInput("store_number", label = "Select Store: ", choices = stores_number)
#```
#Column
#-----------------------------------------------------------------------
#### Time series plot of Sales
#```{r}
#plot(sales$store1, type = "o", pch = 20, col = "tomato", xlab = "Month", ylab = "$")
#```
#### Histogram of Sales
#```{r}
#hist(sales$store1, col = "lightblue", main = "", xlab = "Sales", ylab = "Freq")
#```
Thank you very much for your reply.
In fact I'm an Engineer and I'm starting to use RStudio and packages to create Dashboards so I have problems reading Excel files and the script's structure.
I use R/RStudio to make statistical analisys with packages but I'm not a programming guy (Shame on me, but I'm still learning). Evereything I do in Minitab I do with RStudio. And that is a great alternative.
Before I look for help I tried "reactive({})" but no sucess.
Well, your script/code works perfectly in the way that you did with set.seed ()
But when I try to read my Excel file there are problems when the plot are constructed because (I think) it doesn't understand something in selectedData() or in my file.
Sometimes the show error but sometimes the plots are not showed.
I've tried with "stores_number = list("Store 1"="store1", "Store 2"="store2", "Store 3"="store3")" and with "stores_number = c("Store 1", "Store 2", "Store 3")" but it didn't work.
I don't know if is correct or not but it worked. Please inform if I'm wrong.
Now I have a reactive dashboard reading data from an Excel spreadsheet with columns.
(Most of my problems with R/RStudio is because I have data from Excel spreasheet)
I see - I think the issue was that read_xlsx returns a tibble and you can't select columns using the method used. Another way you could do this and still keep it as a tibble is this: