Who can help me. I established two tibbles. They worked well without any error in the console, but as I knitted it, the console displayed the error: tibble must have compatible sizes. But I checked the code, the sizes can never be different. Here are screenshots:
I passed a 28-data vector (using $ from a data frame) to the third column in this tibble. It worked so well that no problems occurred during the follow-up analysis. But I kept knitting, it just showed the same errors.
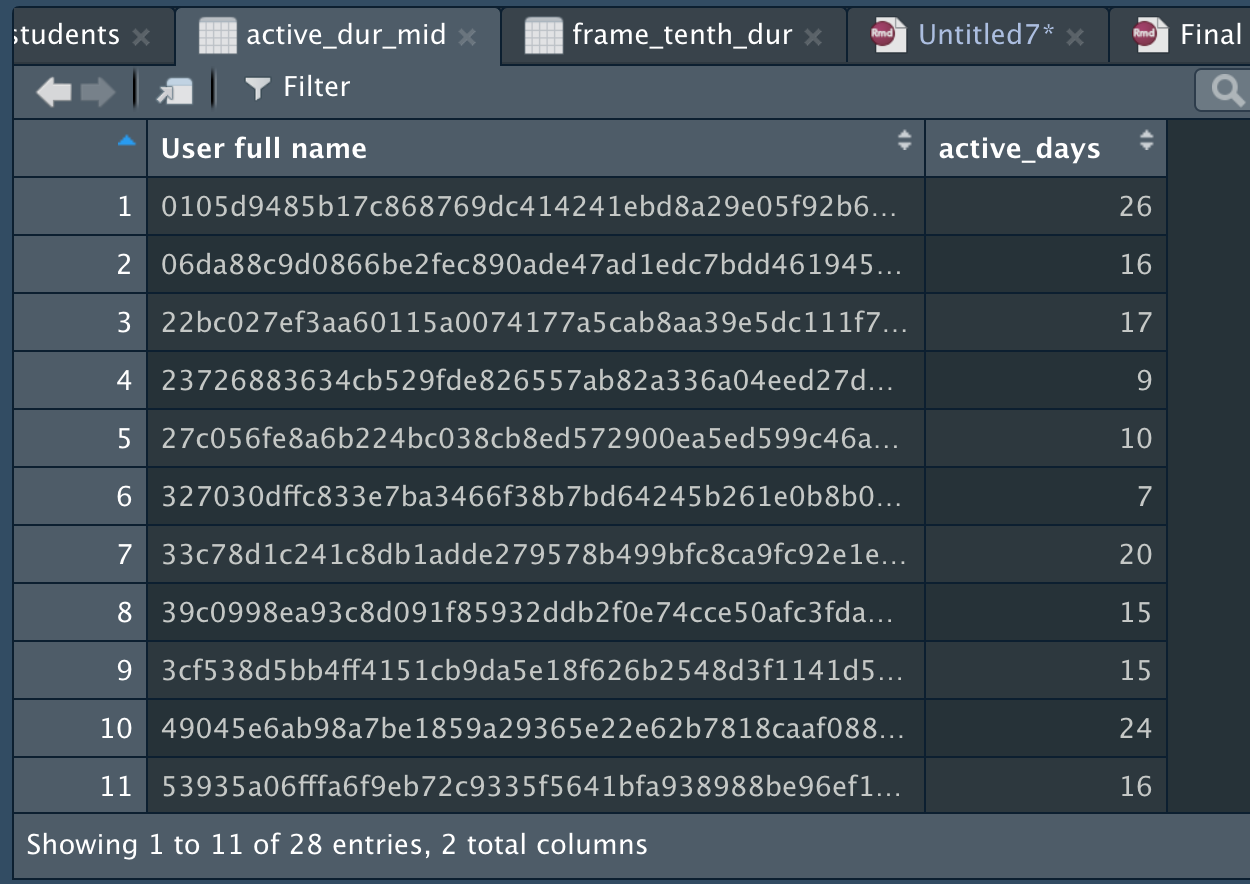
So I used $ to extract the column active days in this screenshot and passed
it to the tibble I set up.
But I can't figure out why the error shows the size is incompatible.
It does look like there are 28 observations, so the problem isn't obvious. It's very hard for anyone to give you advice without the actual data and code. You might do well to post data and code as text (not a screenshot).
because knitting does so in a bare environment, code that relies on objects in your devleopment/working environment can be found to fail; I would review this aspect of your code
The two-column frame in that screenshot I sent last night is set up on the sampled data frame, sampled_tenth. Using filter I extracted a new frame, still_active_af21, and extracted a vector from this new frame. So I created this two-column frame with this vector. There are 28 observations.
arranged_tenth_ <- tenth_01 %>%
arrange(User full name)
namelist1 <- sample(unique(arranged_tenth_$User full name), 80)
sampled_tenth <- arranged_tenth_ %>%
filter(User full name %in% namelist1, date <= '2022-10-30')
still_active_af21 <- sampled_tenth %>%
filter(date <= '2022-10-30' & date > '2022-10-23', Event name %in% c('Grade user report viewed', 'Course viewed', 'Course user report viewed'))
st_active_pupils <- unique(still_active_af21$User full name)
active_dur_mid <- sampled_tenth %>%
filter(User full name %in% st_active_pupils,
date <= '2022-10-24') %>%
select(date, User full name, Event name) %>%
group_by(User full name) %>%
summarise(active_days = length(unique(date)))
Then I tried to create a tibble with the active column in this two-column frame
frame_tenth_dur <- tibble(No = 1:28,
grade = as.vector(rep(1, 28)),
active = active_dur_mid$active_days,
d = as.vector(rep(0, 28)))