Hello!
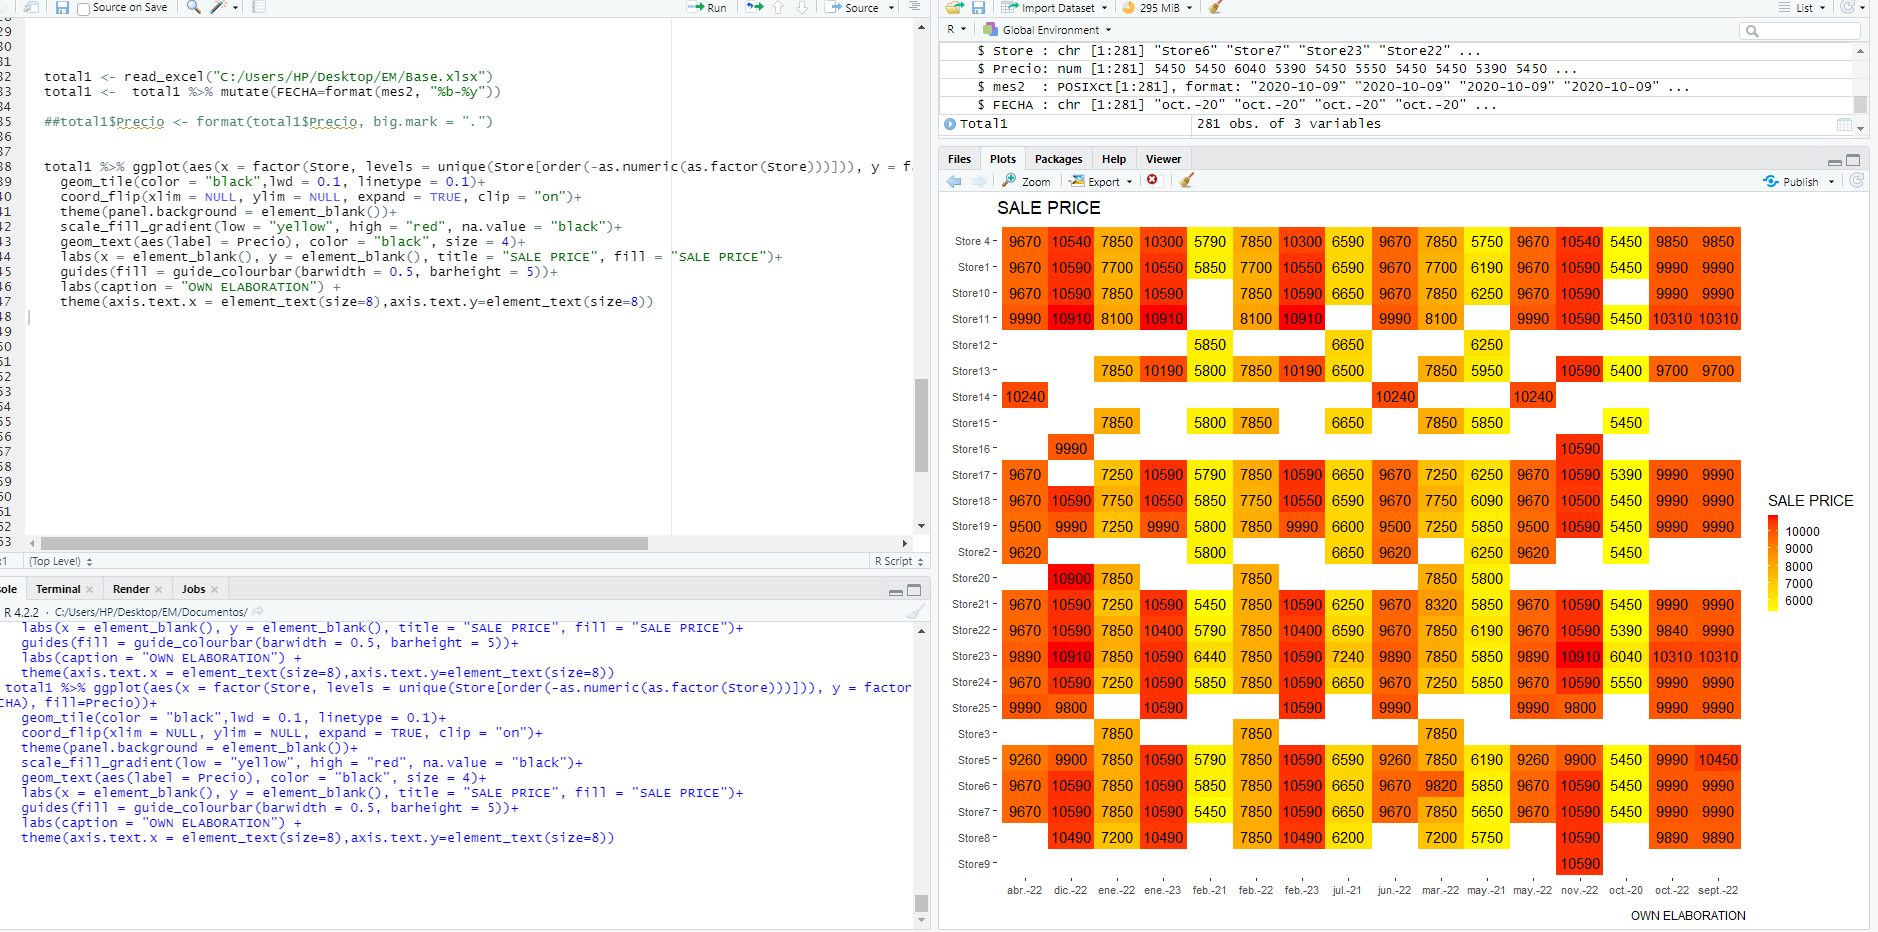
I have tried to assign the empty values of the table the color black but I have not succeeded.
On the other hand, the dates do not appear ordered (the format is month and year) on the axis they are unordered.
And finally, I am not being able to assign thousands separator to the values (using points), when assigning the graphic it appears blank.
total1 <- read_excel("C:/Users/HP/Desktop/EM/Base.xlsx")
total1 <- total1 %>% mutate(FECHA=format(mes2, "%b-%y"))
#total1$Precio <- format(total1$Precio, big.mark = ".")
total1 %>% ggplot(aes(x = factor(Store, levels = unique(Store[order(-as.numeric(as.factor(Store)))])), y = factor(FECHA), fill=Precio))+
geom_tile(color = "black",lwd = 0.1, linetype = 0.1)+
coord_flip(xlim = NULL, ylim = NULL, expand = TRUE, clip = "on")+
theme(panel.background = element_blank())+
scale_fill_gradient(low = "yellow", high = "red", na.value = "black")+
geom_text(aes(label = Precio), color = "black", size = 4)+
labs(x = element_blank(), y = element_blank(), title = "SALE PRICE", fill = "SALE PRICE")+
guides(fill = guide_colourbar(barwidth = 0.5, barheight = 5))+
labs(caption = "OWN ELABORATION") +
theme(axis.text.x = element_text(size=8),axis.text.y=element_text(size=8))