Hello,
I am using XYZ URL layer with leaflet but I can not zoom in after a certain point.
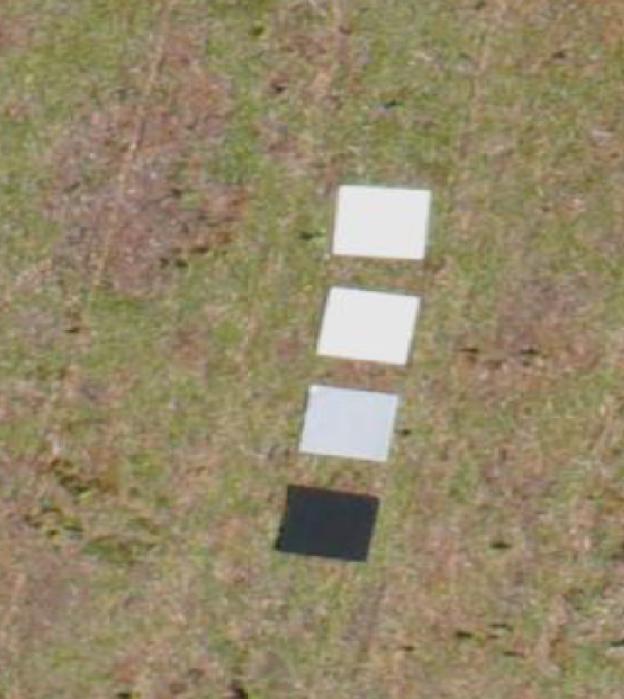
I tried the XYZ layer in QGIS (max Zoom level =23 and min Zoom level = 0) and it works fine. I can see this detail:
However, when I try to use in R with leaflet I can zoom until a certain point with low detail. I checked with mozilla web developer tools/network/ get request and I can see I got to zoom level 18:
GET
	https://api.ellipsis-drive.com/v3/path/898547e8-fd5d-447e-bc3e-7efa5cfaef85/raster/timestamp/7fbb7549-a44e-4171-a516-5d1adc0a32a4/tile/18/132765/97551?style=2ebe8fe0-0780-4ebf-95b3-a321a1f489c8&token=epat_ewb58p9SsXo8OUiX3XP4GZ5aKdX1pd9tfSKsN2kfpCQ0cbwz1aimolEu42OhUBmb
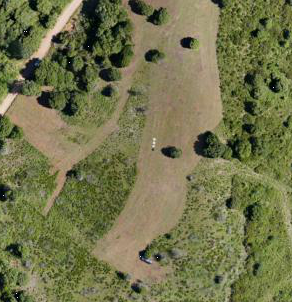
and the images looks like this:
My code in R that produce the R leaflet map is:
urlxyz_hr<-"https://api.ellipsis-drive.com/v3/path/898547e8-fd5d-447e-bc3e-7efa5cfaef85/raster/timestamp/7fbb7549-a44e-4171-a516-5d1adc0a32a4/tile/{z}/{x}/{y}?style=2ebe8fe0-0780-4ebf-95b3-a321a1f489c8&token=epat_ewb58p9SsXo8OUiX3XP4GZ5aKdX1pd9tfSKsN2kfpCQ0cbwz1aimolEu42OhUBmb"

map8 <- leaflet() %>%
    # Base groups
    setView(lng = 2.322 , lat =41.757 , zoom = 18)%>%
    addTiles(group = "OSM (default)") %>%
    addTiles(urlTemplate = urlxyz_hr, group = "ED-HR",
             tileOptions(
              minZoom = 8,
              maxZoom = 23,
              transparent = TRUE,
              unloadInvisibleTiles = NULL,
              maxNativeZoom = FALSE
             )) %>%
    # addTiles(urlTemplate ="https://tile.openstreetmap.org/{z}/{x}/{y}.png") %>%
    addProviderTiles(providers$Stamen.Toner, group = "Toner") %>%
    addProviderTiles(providers$Stamen.TonerLite, group = "Toner Lite") %>%
    addProviderTiles(providers$Esri.WorldImagery, group = "Satview") %>%
     # Layers control
    addLayersControl(
      baseGroups = c("OSM (default)", "Toner", "Toner Lite","Satview","ED-HR"),
      options = layersControlOptions(collapsed = FALSE)
    )
  # map %>% hideGroup("rios temporales")%>%
  #   hideGroup("ca") %>%
  #   hideGroup("aoi") %>%
  #   hideGroup("patrl")
map8 %>%
  addMeasure(
    position = "bottomleft",
    primaryLengthUnit = "meters",
    primaryAreaUnit = "sqmeters",
    activeColor = "#3D535D",
    completedColor = "#7D4479")%>%

  addMiniMap(
    tiles = providers$osm,
    toggleDisplay = TRUE)
As you can see, I set the maxZoom level to 23 but is not getting there. What am I doing wrong?
Thank you for your help,