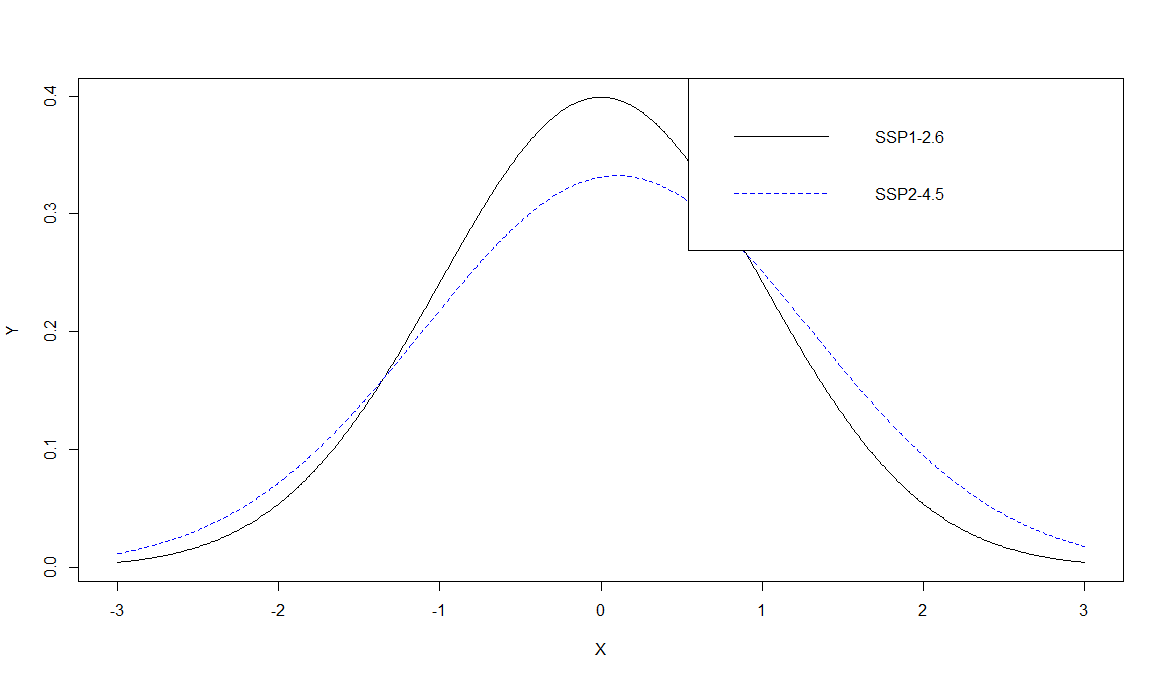
Can you post some data and plotting code that produce the problem? If I run the following code, I do not see any extra space.
DF <- data.frame(X=seq(-3,3,0.01),
                 Y1=dnorm(seq(-3,3,0.01)),
                 Y2=dnorm(seq(-3,3,0.01),0.1,1.2))
plot(DF$X,DF$Y1, col = "black", type = "l", xlab = "X", ylab = "Y")
lines(DF$X, DF$Y2, col = "blue", type = "l", lty = 2)
legend(x="topright", legend = c("SSP1-2.6", "SSP2-4.5"),
       col = c("black","blue"), lty = c(1,2))
You can use the dput() function to produce some code that will build your example data set. Make a subset of your data, just enough to illustrate the problem, and name it, say, DF. Then post the output of
dput(DF)
Yes, I do see the same thing when I maximize the plot window after making the plot. I do not know an elegant fix. One workaround is to make the text of the legend smaller with the cex argument.
legend(x="topright", legend = c("SSP1-2.6", "SSP2-4.5"),
       col = c("black","blue"), lty = c(1,2),cex = 0.5)
Another workaround is to make the plot on a separate large plot window. If you are using a Windows computer, use the windows() function. On Linux, and I suppose MacOS, use x11(). The numbers in the function are the width and height of the window.
windows(16,9)
plot(DF$X,DF$Y1, col = "black", type = "l", xlab = "X", ylab = "Y")
lines(DF$X, DF$Y2, col = "blue", type = "l", lty = 2)
legend(x="topright", legend = c("SSP1-2.6", "SSP2-4.5"),
       col = c("black","blue"), lty = c(1,2),cex = 0.5)
This topic was automatically closed 7 days after the last reply. New replies are no longer allowed.
If you have a query related to it or one of the replies, start a new topic and refer back with a link.