I am trying to make a plot about Three Point Percentages in the NBA. NBA seasons are always between two years (i.e. 2000-2001) but I don't know of a current way to make that year range a date or numerical so I can make them the x axis of my plot. Is this possible in R?
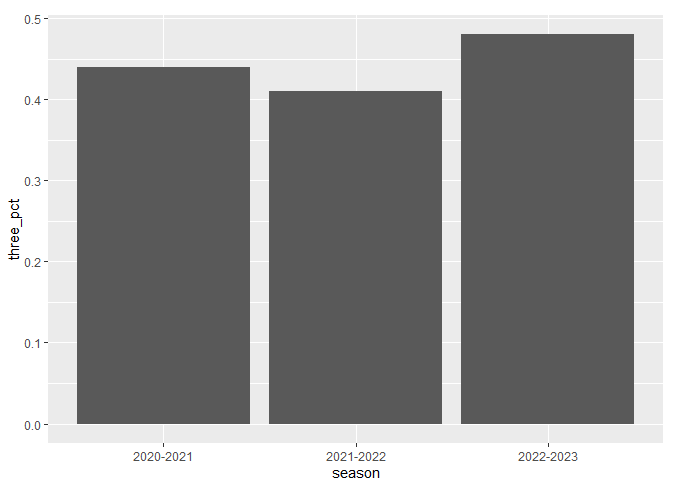
Welcome to the community @yeet! It is possible to plot the seasons on the x-axis as character values (example below). Is there a specific need to change them to date or numeric?