I have a dataset, under which the column value for data and time are included 2021-12-22 16:22:31
to get the month, i ran this code
> triprawdata$date <- as.Date(triprawdata$started_at) #The defalt format is yyyy-mm-dd
>   triprawdata$month <- format(as.Date(triprawdata$date), "%m")```

The output is coming as 01,02,03 denoting the month value
Now if i want to rename this 01,02,03 into Jan,Feb,Mar,.. what should i do ?
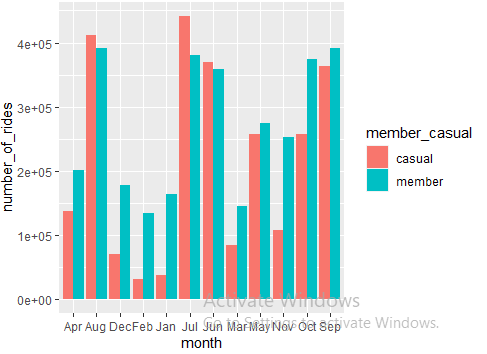
I am attaching the plot,can you check ,how to order this as per month ?
 #total trips by customer type vs month
 triprawdata_v2 %>%
   group_by(member_casual,month) %>%
   summarise(number_of_rides = n()
   ) %>%
   arrange(member_casual, month)  %>%
   ggplot(aes(x = month, y = number_of_rides, fill = member_casual)) +
   geom_col(position = "dodge")
 labs(title ="total trips by customer type vs month")