Hi, i’m not very good with stats but i need it for my uni degree, i managed to make the test but i can’t work out what the results show. The test is whether sound or people affect the behaviour of chimpanzees in a zoo
Thank you for any help
Hi, i’m not very good with stats but i need it for my uni degree, i managed to make the test but i can’t work out what the results show. The test is whether sound or people affect the behaviour of chimpanzees in a zoo
Please post the output of summary(res). Copy the text from the console and put a line with three back ticks just before and after it, like this:
```
Pasted output goes here
```
Do not post an image of the output. They are hard to read.
> summary(res)
Call:
multinom(formula = Behaviour ~ Sound + People, data = Inside)

Coefficients:
                       (Intercept)       Sound      People
Allo groom               20.191780 -0.19745811 -0.04914520
Feed                     16.922365 -0.14765928 -0.11181757
Interact with audience   10.318936 -0.08633028 -0.07792751
Locomotion               19.946837 -0.19249741 -0.03740187
Play                     17.655676 -0.18425771 -0.05502595
Rest                     20.901208 -0.19176669 -0.06268677
Self groom               19.864626 -0.18177308 -0.07400200
Social interaction       18.002833 -0.19029817 -0.03411174
Vigilance                20.670672 -0.18259890 -0.07305530
Vocalisation              5.702606  0.03637439 -0.24030415

Std. Errors:
                       (Intercept)      Sound     People
Allo groom               0.9415861 0.03863663 0.06774980
Feed                     1.6138205 0.04634390 0.07143266
Interact with audience   3.3007663 0.07019391 0.08260947
Locomotion               0.8543270 0.03781416 0.06737277
Play                     1.8222968 0.04915682 0.07231066
Rest                     0.7974161 0.03738436 0.06729931
Self groom               0.9208603 0.03845668 0.06775052
Social interaction       1.4764663 0.04444544 0.06998634
Vigilance                0.7808496 0.03724982 0.06726544
Vocalisation             3.6345954 0.07521700 0.09028406

Residual Deviance: 9204.122
AIC: 9264.122
Coefficients:
                       (Intercept)       Sound      People
Allo groom               20.191780 -0.19745811 -0.04914520
Feed                     16.922365 -0.14765928 -0.11181757
Interact with audience   10.318936 -0.08633028 -0.07792751
Locomotion               19.946837 -0.19249741 -0.03740187
Play                     17.655676 -0.18425771 -0.05502595
Rest                     20.901208 -0.19176669 -0.06268677
Self groom               19.864626 -0.18177308 -0.07400200
Social interaction       18.002833 -0.19029817 -0.03411174
Vigilance                20.670672 -0.18259890 -0.07305530
Vocalisation              5.702606  0.03637439 -0.24030415

Std. Errors:
                       (Intercept)      Sound     People
Allo groom               0.9415861 0.03863663 0.06774980
Feed                     1.6138205 0.04634390 0.07143266
Interact with audience   3.3007663 0.07019391 0.08260947
Locomotion               0.8543270 0.03781416 0.06737277
Play                     1.8222968 0.04915682 0.07231066
Rest                     0.7974161 0.03738436 0.06729931
Self groom               0.9208603 0.03845668 0.06775052
Social interaction       1.4764663 0.04444544 0.06998634
Vigilance                0.7808496 0.03724982 0.06726544
Vocalisation             3.6345954 0.07521700 0.09028406
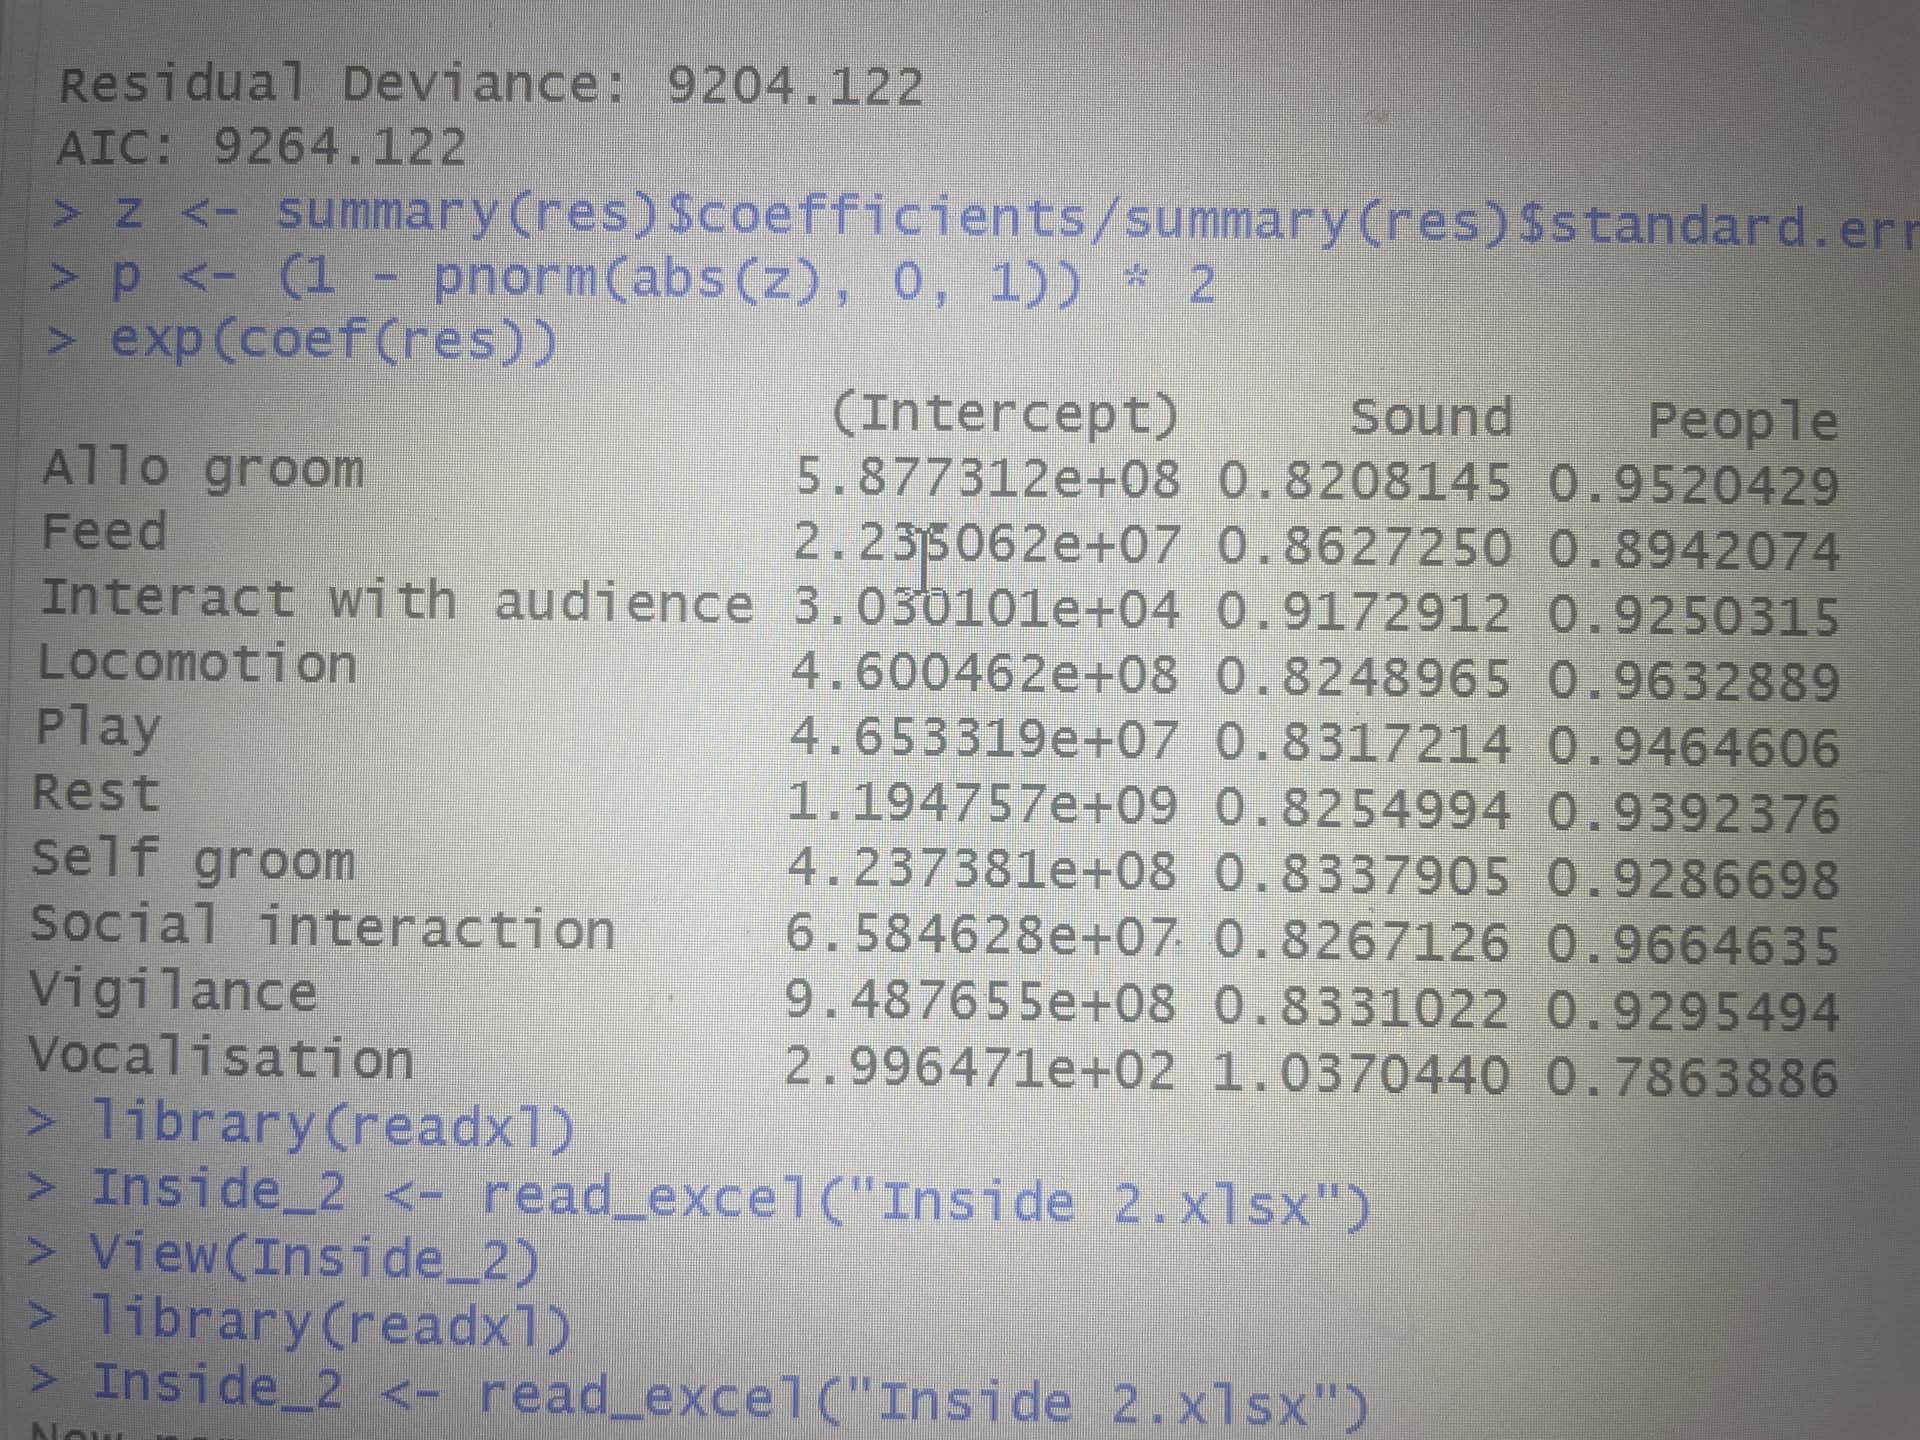
I expected to see other information included in that summary but I can now understand why you did some of the code shown in your firs image. You have calculated an array of p values with the code in your first post. If those p values are below some threshold that you pick (before looking at the results) you could then say that the associated variable has a "significant" effect on the response. That is, that you can discern an effect. Whether that effect is of practical importance is a different question. So first, find which variables are "significant" in the statistical sense and how clear that effect is. The lower the p value the clearer the signal. Then look at the size of the coefficients and the units of measuring Sound and People and how the probability of the observed behavior changes with a one unit change in your input. Look at how the odds ratio and probability are involved in logistic regression. For example, if you were measuring Sound in dB, the change in sound between two environments might be 40 dB. A change of 1 dB might not affect the behavior much but with 40 dB there would be a big effect. If Sound was measured as merely two levels, Loud and Quiet, then your full range is only 1 and the total effect is much smaller.
I hope that gets you started on interpreting the results.
This topic was automatically closed 21 days after the last reply. New replies are no longer allowed.
If you have a query related to it or one of the replies, start a new topic and refer back with a link.