The best place to start is with this CRAN Taskview to get an idea of the range of tools available. From there, I suggest reading the lmer4 vignette. Discrete Data Analysis with R or a similar text should also be consulted if well-being is a discrete (categorical) variable. Another resource is the dagR package for directed acyclic graphs to analyze potential mediating and confounding effects. See this review of the topic in Judea Pearl.
A preliminary analysis can help in selecting a modeling approach. Consider f(x) = y, where
f, x and y are R objects, which may, and often are composites of other objects.
For the study, x might be a data.table or data.frame object containing rows representing subjects and columns representing observations of the variables. Let Y be the response variable well being. Although well being possibly varies continuously from barely alive to healthy and happy across a variety of measures—BMI, performance on standardized tests, connectedness and centrality in social network graphs, etc., Y might be assignment to one of a few ordinal categories. The X—predictor—variables, might be school, age cohort, sport, minutes.
y—the return value of f— some measure of the association of X and Y in x. That is *given observed Y what can we infer about unobserved X and what is the relative contribution of Y_i \dots Y_n to what we can infer? (Or the interest may be in the change, from start to finish or from week to week, of Y.)
What choice of a function object—f—is appropriate to the need? That is, what model is appropriate. Taking the naive approach, we might think that a linear combination of the terms of X would tell something. For simplicity, assume Y is binary, rather than categorical and let's apply linear regression using one continuous variable, X1
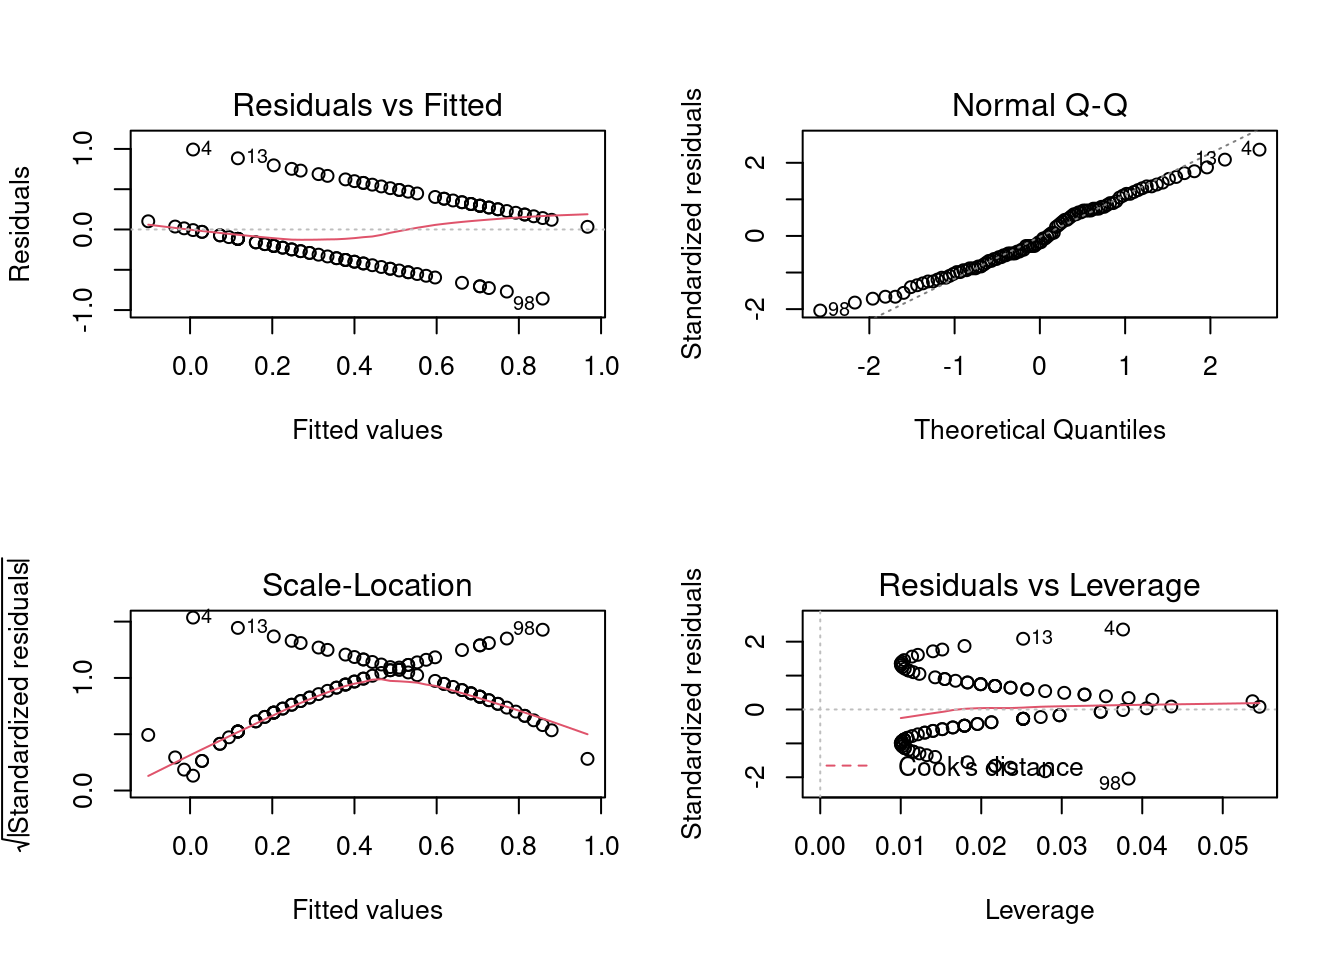
fit <- lm(Y ~ X1, data = our_data)
We would get a model, but the diagnostics would prove problematic
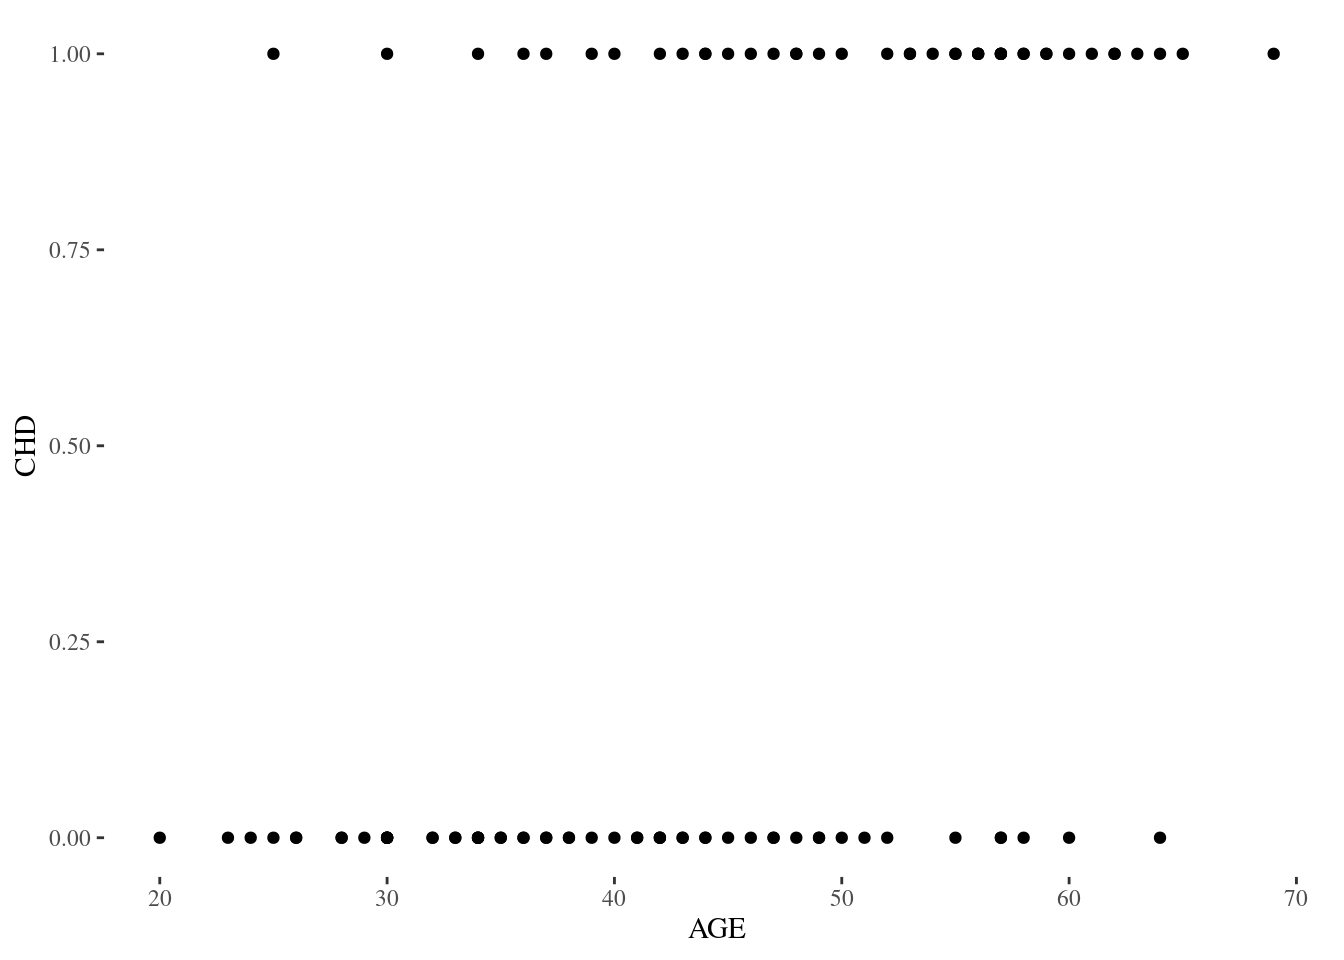
because Y can take only one of two values—it's binary. This can be seen clearly by a simple scatterplot.
In other words, ordinary least squares regression is an inappropriate tool for a problem involving a binary response variable. For that we want an f in the form of
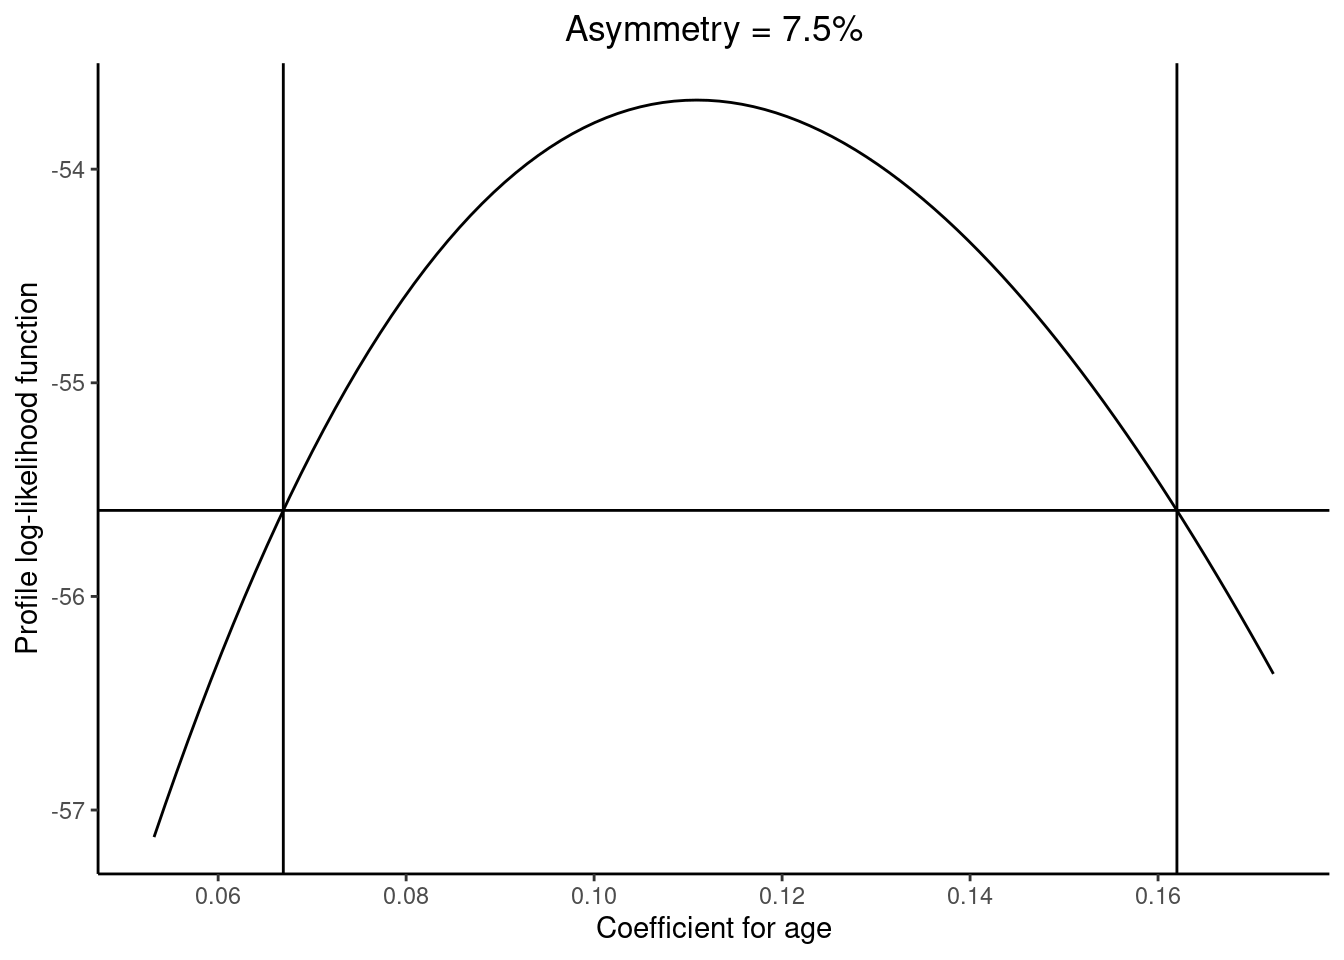
fit <- glm(Y ~ X1, data = our_data)
and after some further work, we get a profile log-likelihood result.
(Examples taken from here.)
However unless well being represented by Y is simply good or poor, the usual logistic regression model does not fit, either, because there may be poor, subpar, neutral, healthy and excellent to set some. For that case there is ordinal logistic regression. It comes in two flavors: proportional odds and forward continuation ratio. See Harrell ch 13.
There are two further complications.
The ordinality assumption must be satisfied—Y behaves in an ordinal fashion with respect to each X.
The time series nature of the data, which may introduce make the value of Y at t_k dependent upon the value at t_j. (See the case study by Harrell at §14.3).
Often time what is more of a challenge than how.