I have a question that seems like it should have a super easy answer, which I am probably just unaware of. (if this has been posed and answered before, please feel free to just link with a URL. I could not find anything).
I have a long format dataset with numerous firms over time (date is a class date variable at the moment). Each firm has a discrete policy intervention point, but they do not occur on the same date.
What I want to do is to generate a new variable that is a count of days (e.g. -30 to 30) on either side of each firm's intervention point. I would then plot that new variable on my x-axis in ggplot and show how the intervention played out across each firm.
Any suggestions would be helpful (happy to widen the dataset or whatever.
there are some informations missing in my opinion. First, you should provide a bit of data (use dput() or make some toy data with identical class attributes and general structure). Second, since this is not clear from your request, how is the date variable coded? Are those 1-day difference dates for each firm? Or is it some kind of "first registered at XX.XX.XXX" and the second date would be "discrete policy intervention at XX.XX.XXXX"? And last but not least, how should your expected outcome look like? Do you wish to have 3 dates (first occurence is N days before policy - policy at date X - current date is M days after policy)? Or should it be a continous list starting at the first registered date to the current date (or last date in the dataset?).
Maybe you can provide a bit of data and a more specific expected outcome. Or at least some more informations.
So the date variable is daily as class date (2022-01-01, e.g.) and goes from the start of 2022 to present.
The dates of the intervention happen at various arbitrary points through out the year. So firm X might have a date of intervention of Jan 10 and firm Y would have an intervention of Aug 21. The goal is to plot all of these on the same graph with a harmonized intervention point.
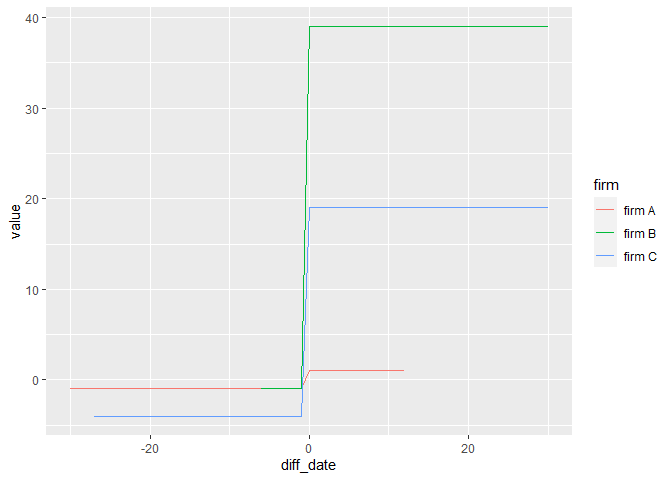
So, the ideal final plot would be and x axis that is -30 to 30 and then separate geom_lines for each firm. Zero would be each firm's distinct intervention point.
since you did not provide some data, a vast majority of the code is due to the dummy data creation. Is this somewhat what you wanted?
library('data.table')
library('collapse')
library('ggplot2')

# some Dummy Data
treat_day <- as.Date( as.Date('2022-01-01') + sample(1:length(seq.Date(as.Date('2022-01-01'), to = Sys.Date(), by = 'day')),3) )
treat_data <- data.table(
  firm = c('firm A','firm B','firm C'), treat = treat_day
)

Data <- data.table(
  firm  = rep(c('firm A','firm B','firm C'), each = length(seq.Date(as.Date('2022-01-01'), to = Sys.Date(), by = 'day'))),
  date  = rep(seq.Date(as.Date('2022-01-01'), to = Sys.Date(), by = 'day'), 3)
  # since you did not specify, I just assume there is a outcome between -5 and 0 up to the treat and 0 to 50 afterwards
) |> (\(x) treat_data[x, on = c('firm')])() |>
  ftransform(treat = fifelse(treat == date, 1L, 0L)) |>
  fmutate(counter = fcumsum(treat, firm)) |>
  fgroup_by(firm) |>
  fmutate(value = fifelse(counter == 0L, sample((-1) * 0:5,1), sample(0:50,1))) |>
  fungroup() |>
  fselect(-counter)

# to cut off the 30 days before and after the treat, we just have to take out the treatment days and use them as LuT
LuT <- Data |>
  fsubset(treat == 1L) |>
  fselect(firm,'treat_date' = date)

# do the cutoff by joining and then subtracting
Data |>
  (\(x) LuT[x, on = 'firm'])() |>
  fmutate(diff_date = as.integer(date - treat_date)) |>
  fsubset(diff_date %inrange% c(-30,30)) |>
  ggplot() +
  geom_line(aes(x = diff_date, y = value, col = firm))