Hi,
I have a dataset which I use for tracking surveys. The supervisors and their respective scores are given date-wise. I want to get a line graph of the scores over the project duration.
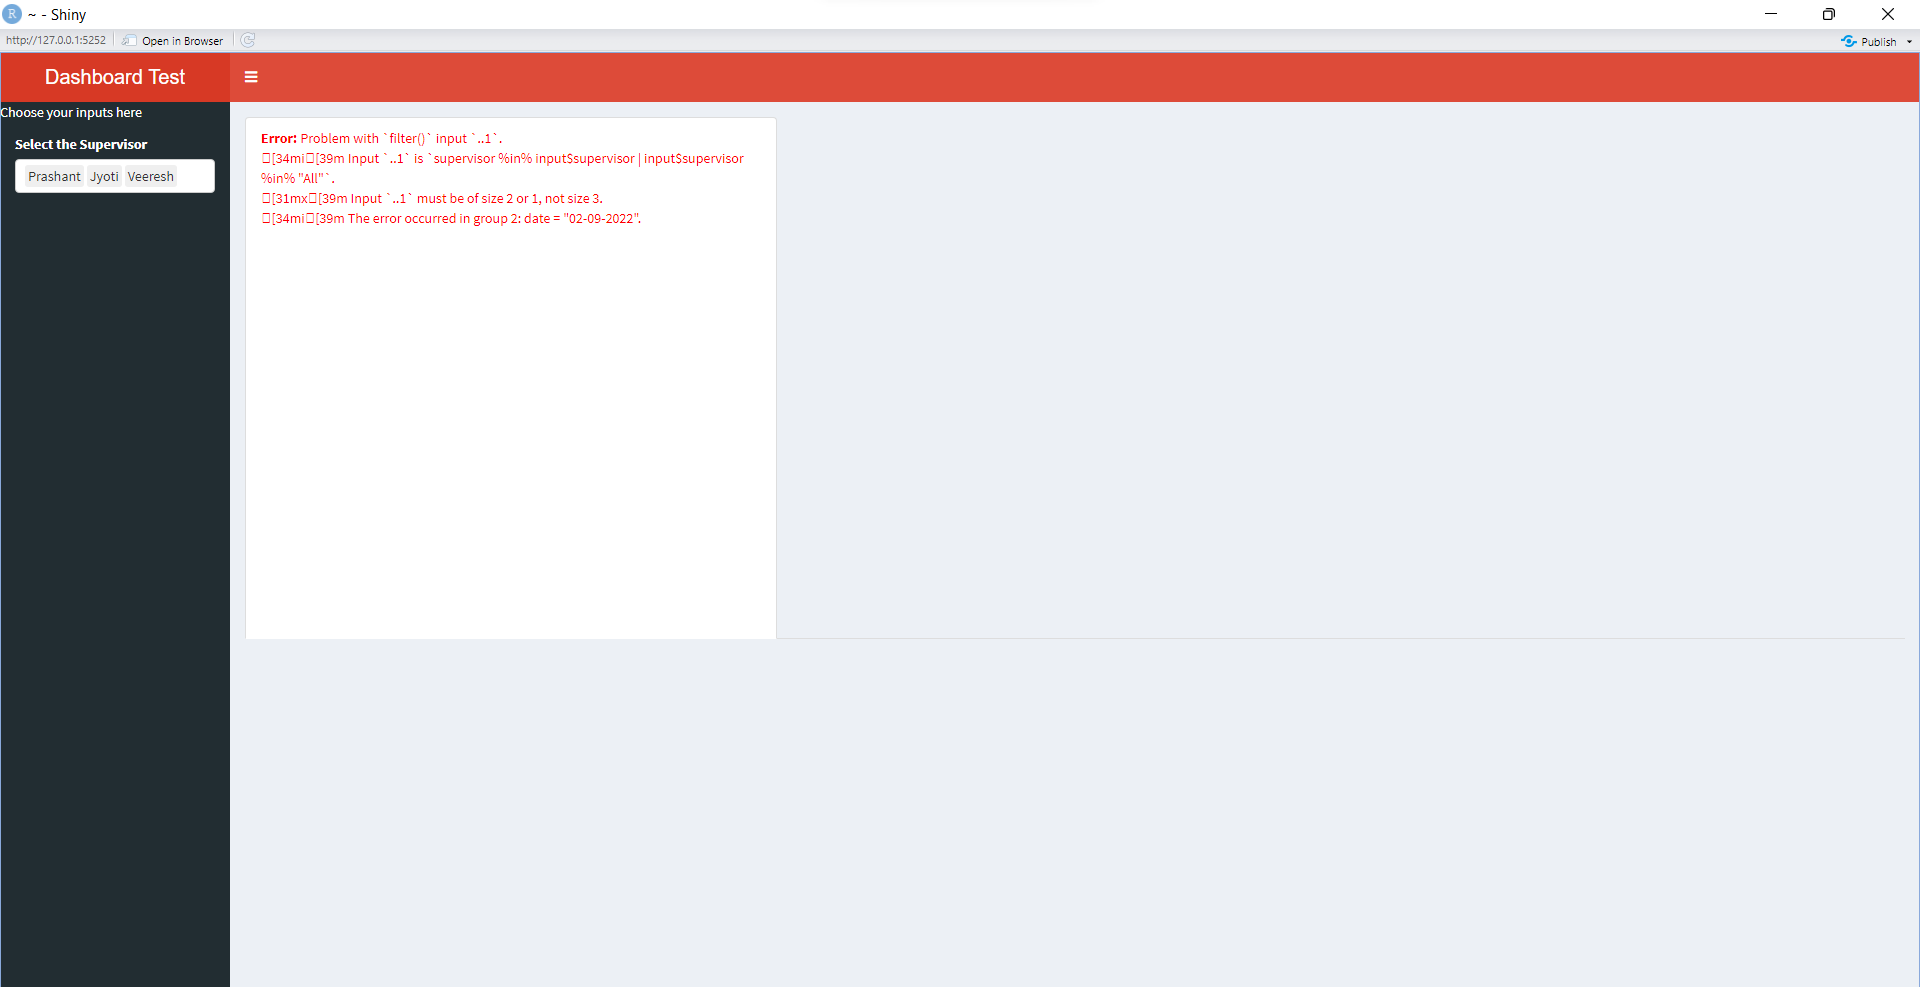
In selectInput I have given multiple=T, but when I run the app and select the 3 supervisors, the graph does not show up. When I select the first and second supervisor, the graph appears correctly. But the moment I select the third one also, I get an error message. Giving the reproducible example here and the screenshot of the error. Can someone soon chip in to help??
library(tidyverse)
library(shiny)
library(shinydashboard)
library(janitor)
data<-tibble::tribble(
  ~date, ~supervisor, ~score,
  "27-08-2022",     "Jyoti",    92L,
  "28-08-2022",     "Jyoti",    86L,
  "29-08-2022",     "Jyoti",    85L,
  "30-08-2022",     "Jyoti",    88L,
  "31-08-2022",     "Jyoti",    61L,
  "01-09-2022",     "Jyoti",    60L,
  "02-09-2022",   "Veeresh",    78L,
  "27-08-2022",   "Veeresh",    75L,
  "28-08-2022",   "Veeresh",    70L,
  "29-08-2022",   "Veeresh",    66L,
  "30-08-2022",   "Veeresh",   100L,
  "31-08-2022",   "Veeresh",    82L,
  "01-09-2022",   "Veeresh",    53L,
  "02-09-2022",  "Prashant",    74L,
  "27-08-2022",  "Prashant",    60L,
  "28-08-2022",  "Prashant",    80L,
  "29-08-2022",  "Prashant",    89L,
  "30-08-2022",  "Prashant",    90L,
  "31-08-2022",  "Prashant",    83L,
  "01-09-2022",  "Prashant",    64L,
  "02-09-2022",  "Prashant",    50L
)

ui<-dashboardPage(
  skin = "red",
  dashboardHeader(title = "Dashboard Test"),
  dashboardSidebar("Choose your inputs here",
                   selectInput("supervisor","Select the Supervisor",choices = c("All",unique(data$supervisor)),multiple = T)),
  dashboardBody(
    tabsetPanel(
      tabPanel(plotOutput("plot1",width = 500,height = 500))
    )
  ))

server<-function(input,output,session){

  field_sup_avg<-reactive({
    req(input$supervisor)

    data %>%
      group_by(date,supervisor) %>%
      summarise(avg_score=mean(score)) %>%
      filter(supervisor %in% input$supervisor|input$supervisor %in% "All")
  })

  output$plot1<-renderPlot({
    req(field_sup_avg())

    ggplot(field_sup_avg(),aes(date,avg_score,group=supervisor))+
      geom_line(size=1.5)+
      geom_point(size=2)+
      theme_minimal()
  })


}

shinyApp(ui,server)
#> PhantomJS not found. You can install it with webshot::install_phantomjs(). If it is installed, please make sure the phantomjs executable can be found via the PATH variable.
Shiny applications not supported in static R Markdown documents
Created on 2022-09-10 by the reprex package (v2.0.1)