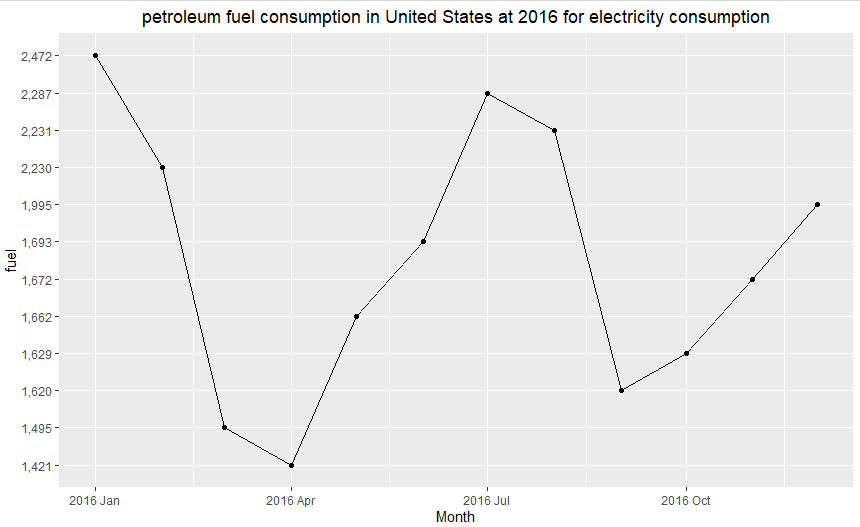
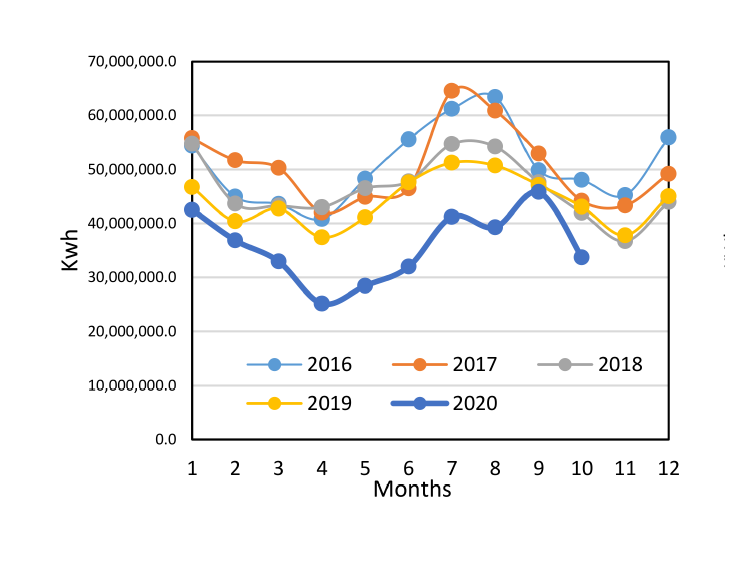
I am very new in R. I wanted to plot a monthly time series of five years fuel consumption. But when I put all five years (5*12) = 60 data in one file, the plot is not coming. When I tried for each year, it comes.
I hope the code is self explanatory, at least with the comments I made in between. I use data.table to manipulate the data out of personal preference, but you can use base R, tidyverse or whatever to do so if you wish:
Data <- data.frame(
month = paste(rep(2016:2020,each = 12), month.abb),
fuel = sample(seq.default(1e6,1e7,1e4), 60)
)
### you can split the "year mon" column into two columns
library(data.table)
Data <- as.data.table(Data)
Data[, c('year','month') := tstrsplit(month, "\\s")]
### convert the months to correct factors, so the labels are in correct order
Data[,month := factor(month, levels = month.abb)]
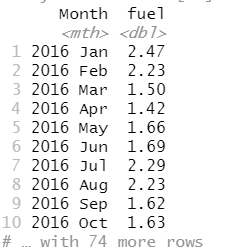
head(Data)
#> month fuel year
#> 1: Jan 9250000 2016
#> 2: Feb 6050000 2016
#> 3: Mar 8520000 2016
#> 4: Apr 7030000 2016
#> 5: May 7750000 2016
#> 6: Jun 7700000 2016
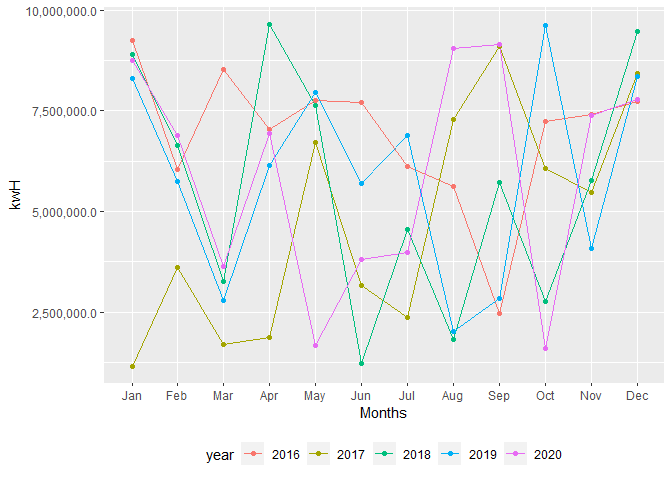
### Plotting
library(ggplot2)
Data |>
### specify month on x axis and fuel on y axis
ggplot(aes(x = month, y = fuel)) +
### add lines per year (since the x axis is defined as factor, groups is necessary)
geom_line(aes(col = year, group = year)) +
### add additional points
geom_point(aes(col = year)) +
### match axis title
labs(
x = 'Months', y = 'kwH'
) +
### axis text without scientific notation
scale_y_continuous(labels = scales::label_number(big.mark = ',', decimal.mark = '.', accuracy = 0.1)) +
### position the legend underneath the plot
theme(
legend.position = 'bottom'
)
If you want the numbers instead of month abbreviations on the x axis, you just have to add either a column with 1 to 12 for each year, or if there are gaps or other issues, create a look up table and join based on a month column. But I thought abbrevations might be fine here?