I can't upload a second image for the graph from the textbook.
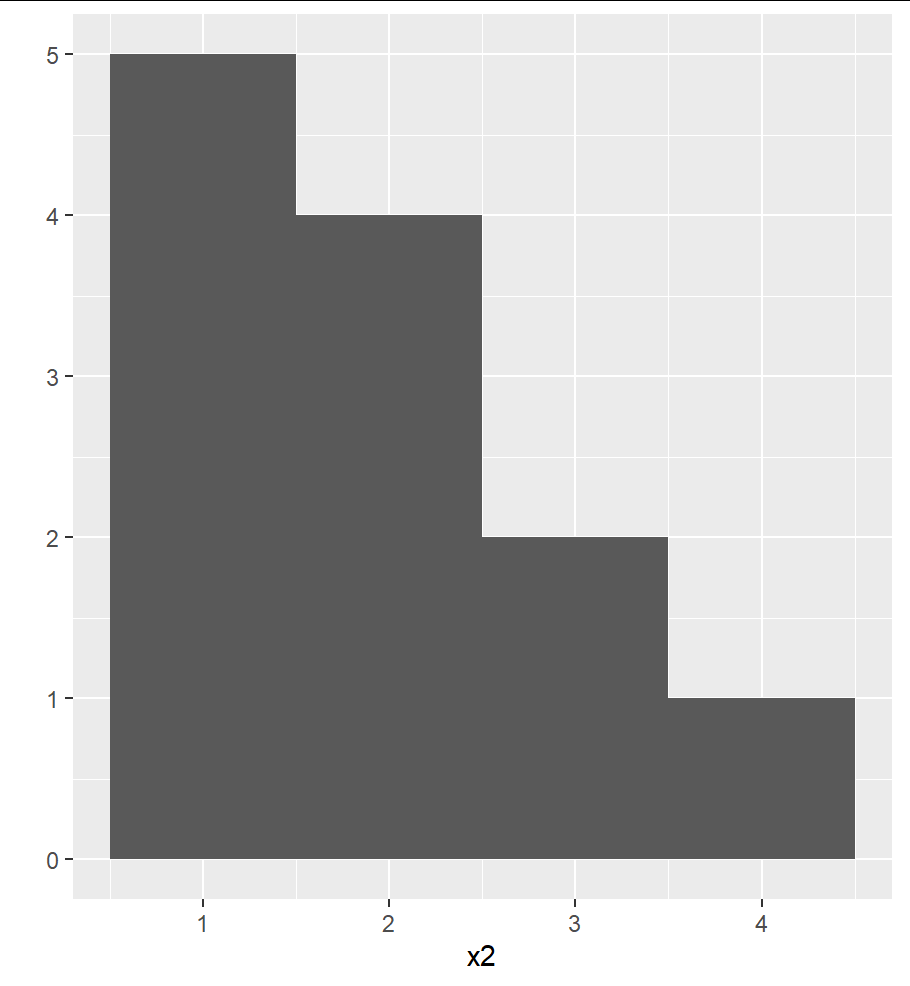
My graph starts at the wrong number, in the textbook, the first bar sits between 1 and 2 on the x-axis
It is different in other ways too- it does not have a y-axis label, and the columns seem broader than the example in the textbook. What have I misunderstood?
I believe the first edition of that book was published 7 years ago.
To get the same results I would expect that you would need to be aligned to the same ggplot2 version as that of the book. What edition of the book do you have? does it say what version of ggplot2 it was using ?
Sidenote that 2months ago the ggplot2 devlopment code added the following comments:
#' `qplot()` is now deprecated in order to encourage the users to
#' learn [ggplot()] as it makes it easier to create complex graphics.
So I would suggest not to worry about it, and focus more on ggplot2 lessons, whether on the book as mentioned , or the r4ds book