Hi
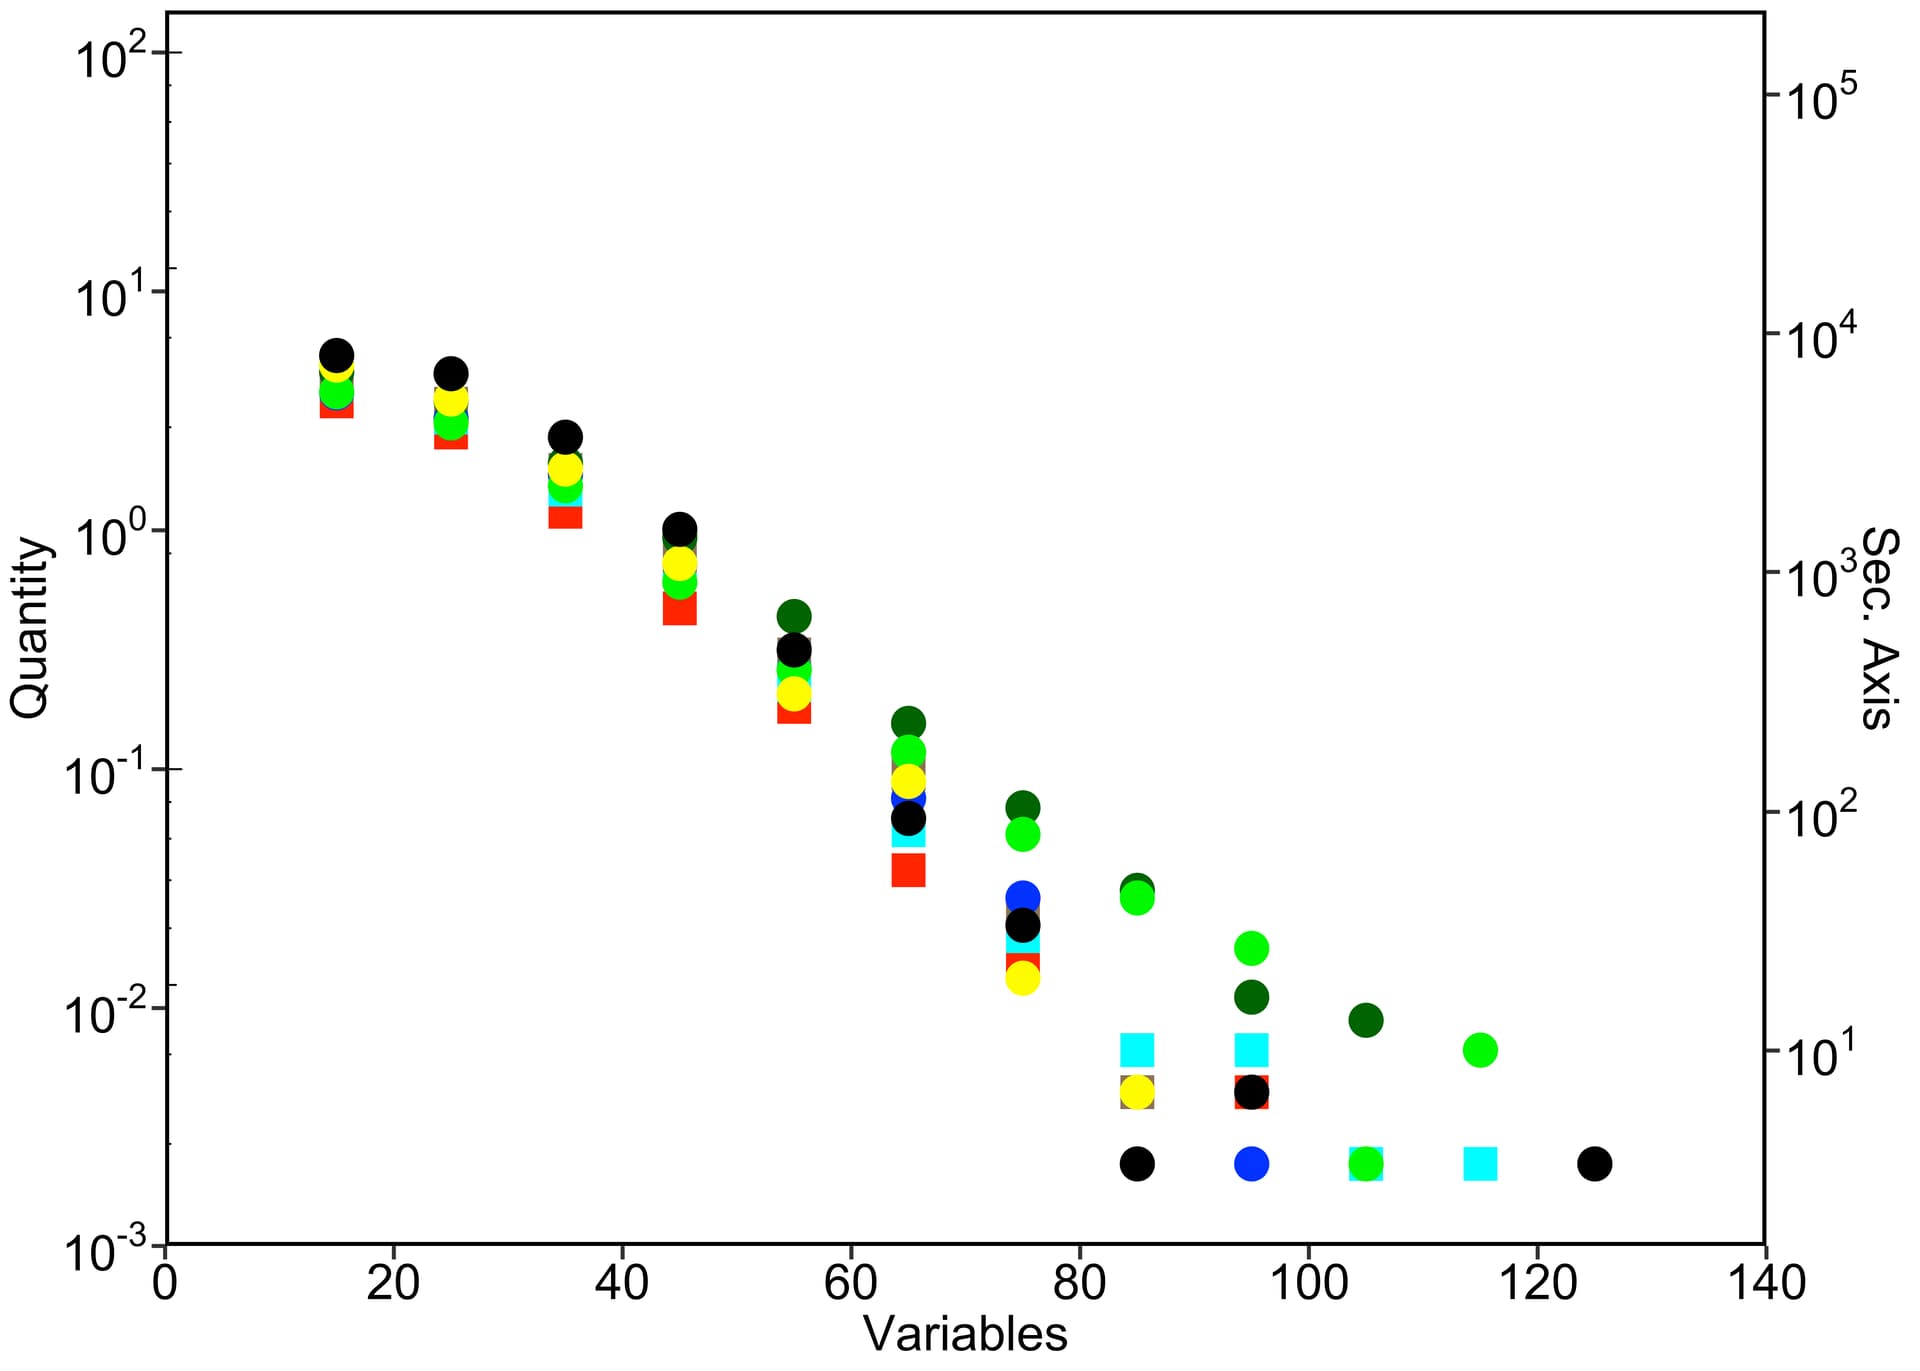
q <- p + scale_y_continuous(expand = c(0, 0), trans = pseudo_log_trans(0.0001, 1000), breaks=c(0.001,0.01,0.1,1,10,100), limits=c(0.001,150),
    labels = scales::trans_format("log10", scales::math_format(10^.x)),
    sec.axis = sec_axis(~.*1500, name = "Sec. Axis", breaks=c(1,10,100,1000,10000,100000),
     labels = scales::trans_format("log10", scales::math_format(10^.x))))
q + annotation_logticks(sides="l")
How to align the log ticks accurately on the primary y-axis.
In ?annotation_logticks
These tick marks probably make sense only for base 10.
And indeed, if you change that:
trans = scales::pseudo_log_trans(0.0001, base = 10),
it's aligned.
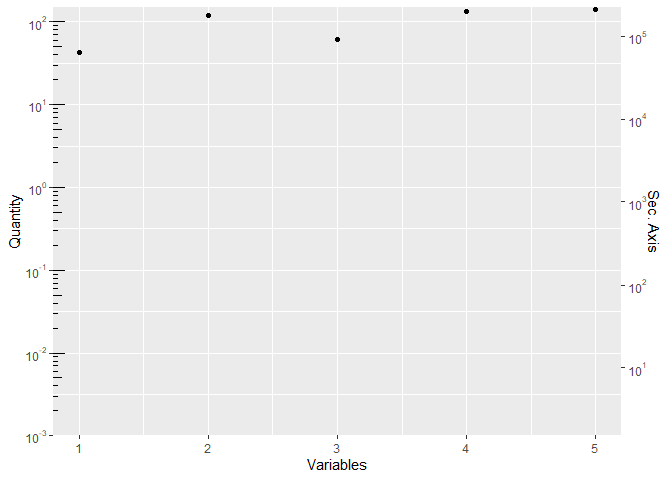
reprex :
library(ggplot2)
library(tibble)

set.seed(123)
dat <- tibble(Variables = 1:5,
              Quantity = runif(5, .001, 150))

dat
#> # A tibble: 5 × 2
#>   Variables Quantity
#>       <int>    <dbl>
#> 1         1     43.1
#> 2         2    118.
#> 3         3     61.3
#> 4         4    132.
#> 5         5    141.

p <- ggplot(dat) +
  geom_point(aes(x = Variables, y = Quantity))

q <- p +
  scale_y_continuous(expand = c(0, 0),
                     trans = scales::pseudo_log_trans(0.0001, 10),
                     breaks=c(0.001,0.01,0.1,1,10,100),
                     limits=c(0.001,150),
                     labels = scales::trans_format("log10",
                                                   scales::math_format(10^.x)),
                     sec.axis = sec_axis(~.*1500,
                                         name = "Sec. Axis",
                                         breaks=c(1,10,100,1000,10000,100000),
                                         labels = scales::trans_format("log10",
                                                                       scales::math_format(10^.x))))
q + annotation_logticks(sides="l")
Created on 2023-01-19 by the reprex package (v2.0.1)
1 Like
That works. Thank you, I appreciate the help. I have a follow-up question, would it be possible to do the same for the secondary y-axis?
system
January 27, 2023, 1:23am
4
This topic was automatically closed 7 days after the last reply. New replies are no longer allowed.