Hello
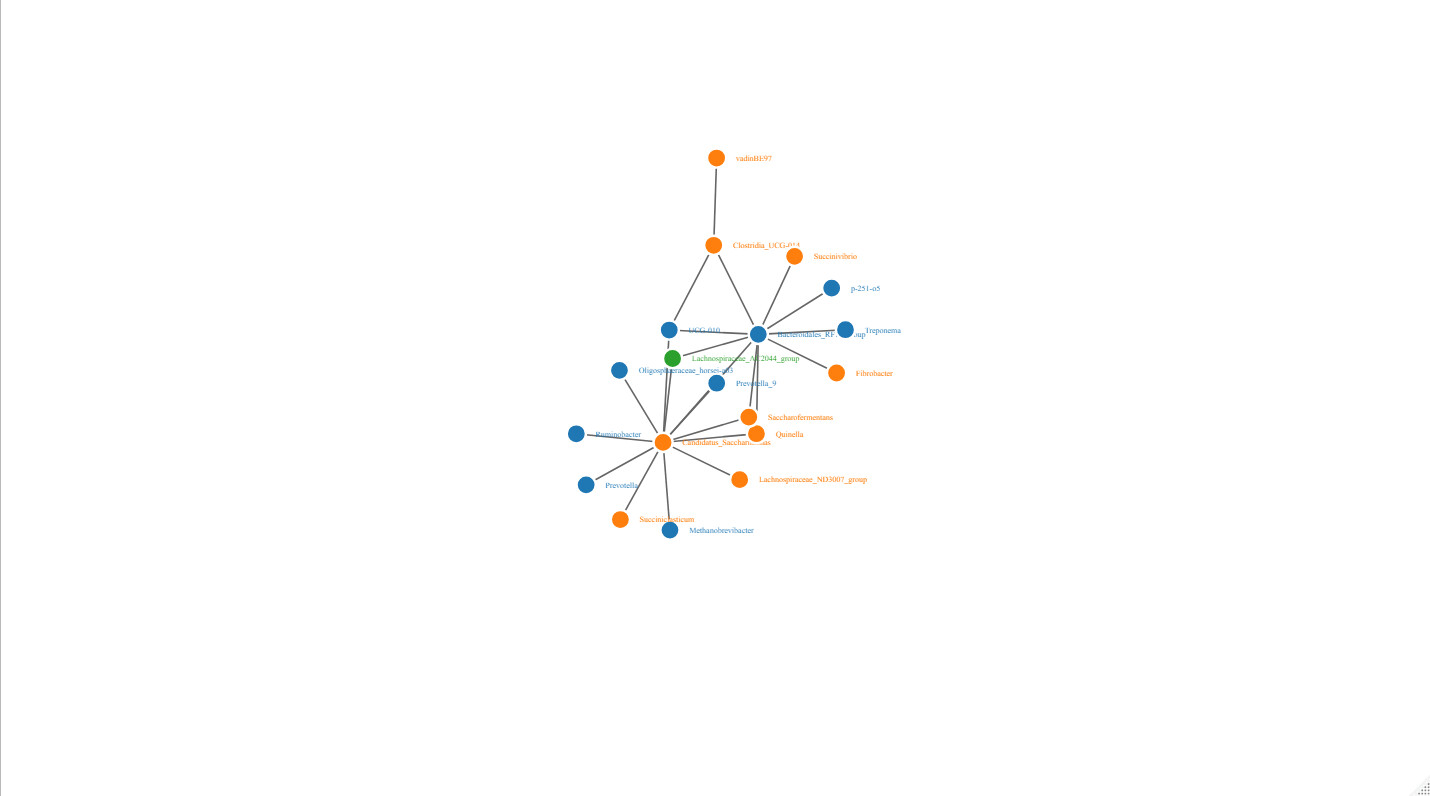
I am working on drawing a network in R based on co-occurrence results. I have already created a network using Gephi, but I prefer the output of R software. However, I am having trouble getting my input file to match the network. For example, Bacteroidales_RF16_group and Lachnospiraceae_AC2044_group should have many connections, but the resulting networkd3 visualization does not reflect this. Could you please help me identify where I may have made a mistake in my code?
library(networkD3)
library(ggnet)
nodes <- tibble::tribble(
~name, ~carac,
"Bacteroidales_RF16_group", "Exclusive",
"Candidatus_Saccharimonas", "Nt",
"Clostridia_UCG-014", "Nt",
"Fibrobacter", "Nt",
"Lachnospiraceae_AC2044_group", "Key",
"Lachnospiraceae_ND3007_group", "Nt",
"Methanobrevibacter", "Exclusive",
"Oligosphaeraceae_horsej-a03", "Exclusive",
"p-251-o5", "Exclusive",
"Prevotella", "Exclusive",
"Prevotella_9", "Exclusive",
"Quinella", "Nt",
"Ruminobacter", "Exclusive",
"Saccharofermentans", "Nt",
"Succiniclasticum", "Nt",
"Succinivibrio", "Nt",
"Treponema", "Exclusive",
"UCG-010", "Exclusive",
"vadinBE97", "Nt",
"Victivallaceae", "Nt"
)
links <- tibble::tribble(
~source, ~target, ~cor,
"Bacteroidales_RF16_group", "Candidatus_Saccharimonas", 0.8195,
"Bacteroidales_RF16_group", "Clostridia_UCG-014", 0.6856,
"Bacteroidales_RF16_group", "Fibrobacter", 1,
"Bacteroidales_RF16_group", "Lachnospiraceae_AC2044_group", 0.7914,
"Bacteroidales_RF16_group", "Lachnospiraceae_ND3007_group", 0.6985,
"Bacteroidales_RF16_group", "Prevotella", -0.8571,
"Bacteroidales_RF16_group", "Ruminobacter", -0.7286,
"Bacteroidales_RF16_group", "Succiniclasticum", -0.9158,
"Bacteroidales_RF16_group", "Treponema", 1,
"Bacteroidales_RF16_group", "UCG-010", -0.833,
"Bacteroidales_RF16_group", "vadinBE97", 0.6301,
"Lachnospiraceae_AC2044_group", "Lachnospiraceae_ND3007_group", 0.8117,
"Lachnospiraceae_AC2044_group", "Methanobrevibacter", 0.6117,
"Lachnospiraceae_AC2044_group", "Oligosphaeraceae_horsej-a03", 0.9252,
"Lachnospiraceae_AC2044_group", "p-251-o5", 0.7553,
"Lachnospiraceae_AC2044_group", "Prevotella_9", -0.6011,
"Lachnospiraceae_AC2044_group", "Quinella", 0.6428,
"Lachnospiraceae_AC2044_group", "Ruminobacter", -0.7616,
"Lachnospiraceae_AC2044_group", "Saccharofermentans", 0.6772,
"Lachnospiraceae_AC2044_group", "Succiniclasticum", -0.7396,
"Lachnospiraceae_AC2044_group", "Succinivibrio", -0.6334,
"Lachnospiraceae_AC2044_group", "vadinBE97", 0.9465,
"Treponema", "vadinBE97", -0.8368,
"Treponema", "Victivallaceae", -0.6774
)
links$source=as.numeric(as.factor(links$source))-1
links$target=as.numeric(as.factor(links$target))-1
forceNetwork(
Links=links,
Nodes=nodes,
NodeID = "name",
Group = "carac",
)
Output:
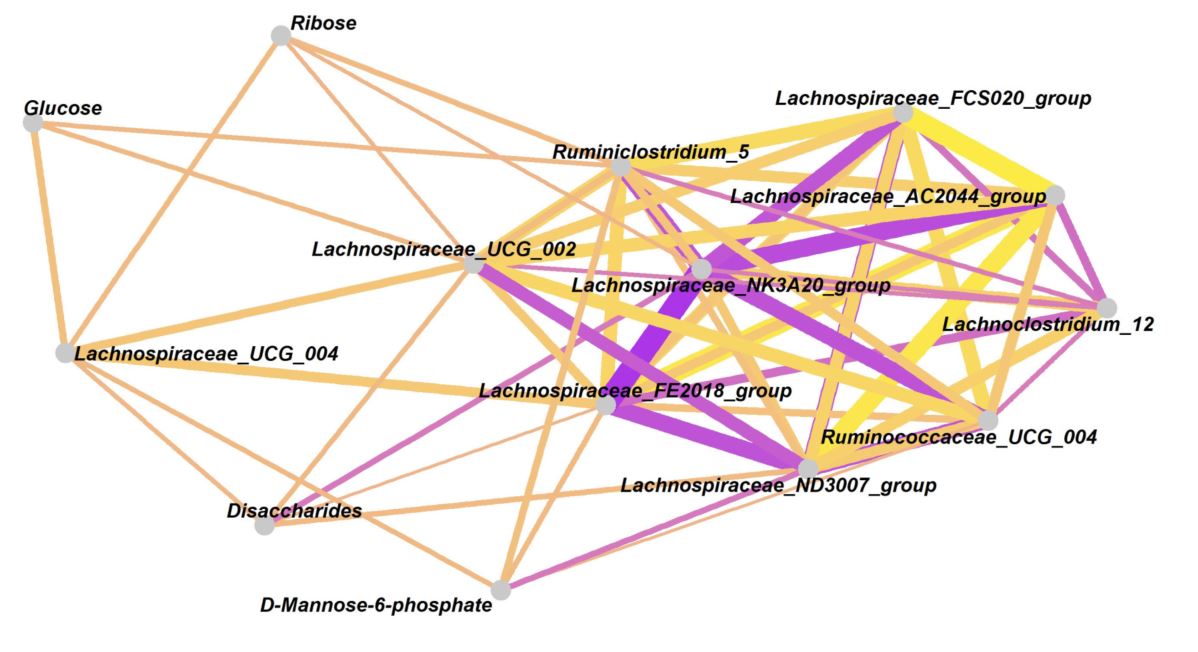
P.S, I would like to draw like below figure. Please give some advice. Thank you.
Sorry for not using "reprex" due to several issues in my R.