Partial dashed line ggplot

Hi,

I have a dataset

  Wavelength NCORE_June_29 PILS_June_29 PILS_June_30
       <dbl>         <dbl>        <dbl>        <dbl>
1        300         28.4        47.3          82.2 
2        350         21.4        21.8          43.6 
3        365         19.4        17.5          36.3 
4        405         13.9         9.01         21.7 
5        430          8.99        6.01         16.1 
6        445          8.34        5.14         12.9 
7        500          5.93        3.49          6.40
8        532          3.72        2.52          5.01
9        550          2.48        0.807         1.32

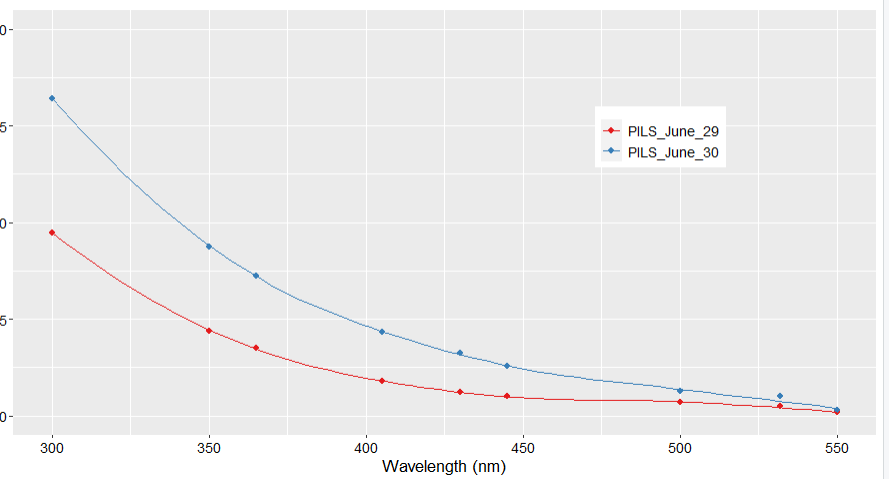
The plot from this data could be like

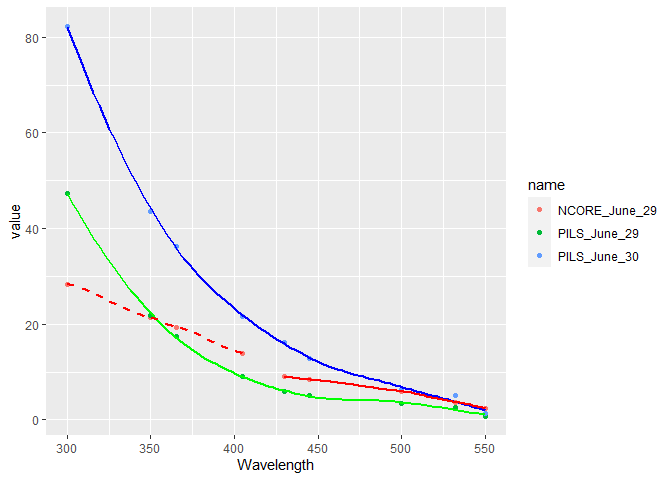
But, in this plot, I want to make the partial dashed line for NCORE_June_29 such as:
half line with a solid line with Wavelength>405 and
half line with a dashed line with Wavelength<=405)
Or
I would say geom_smooth lines (solid and dashed).
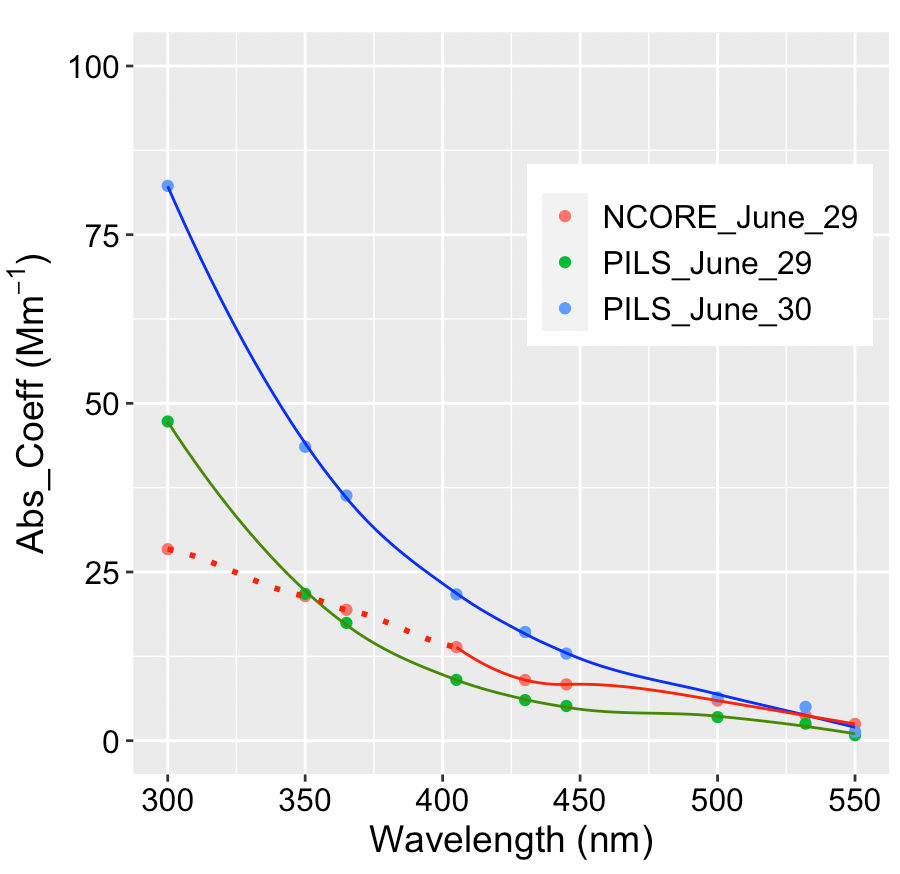
I am trying via:

wavelength01 %>% 
  gather(variable, value, NCORE_June_29:PILS_June_30) %>% 
  ggplot(aes(x = Wavelength, y = value, group = variable, fill = variable)) +
  geom_point(aes(color = variable), size=2) + 
  #geom_line(data=subset(wavelength01, Wavelength<=405), aes(linetype='dotted line')) +
  geom_smooth(aes(color = variable), size = 0.5, se = FALSE)+ 
  theme(legend.text=element_text(size=12)) + 
  theme(legend.title=element_blank()) +
  theme(legend.position = c(0.75, 0.7)) +
  theme(axis.title = element_text(face="plain",size=14,color="black"),
        axis.text=element_text(size=12,face="plain", color="black"),
        plot.title = element_text(size=15)) +  
  scale_color_brewer(palette="Set1")+
  ylab(bquote('Abs_Coeff ('*Mm^-1*')')) +
  xlab(bquote('Wavelength ('*nm*')')) +
  labs(title = "")+ ylim(0,100)

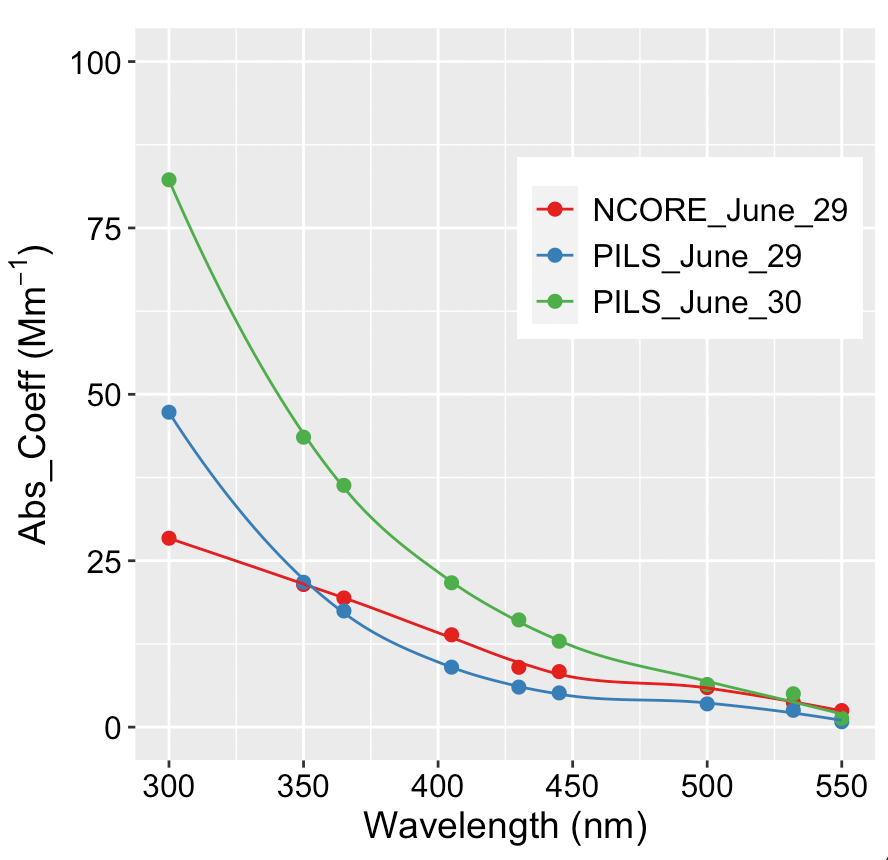
But not able to get the output:

Any help!

Thanks

just to simplify it you may take out the NCORE_JUNE_29 out from wavelength01 :

then define two variables i.e : with the same structured
P1 filtered for all NCORE with wavelength less than 450 with line type : dotted
P2 filtered for all NCORE with wavelength greater or equal than 450

then after add the two variables P1+P2 to wavelength01

hope this useful
Kind Regards

Hi,

Thanks for your time.
But, I could not understand how to apply your method in my code.
Could you provide an example with the figure?

am sorry for the confusion , that method didn't work
i tried to split the line by applying the following :

ggplot(wavelength01,aes(x = Wavelength, y = NCORE_June_29)) +geom_point()+geom_line(data=subset(wavelength01, Wavelength<=405), linetype=1) +
geom_line(data=subset(wavelength01, Wavelength>405), linetype=2)

but i couldn't include it in the same graph when i modified your codes .. i couldn't figure out how to solve this error :slight_smile:

very interesting .. looking for a solution for it

Here is a rough version of the plot I think you want. . It seems geom_smooth does not like fitting a small number of points and I did not take the time to adjust the smooth arguments.

library(ggplot2)
library(tidyr)
library(dplyr)
#> 
#> Attaching package: 'dplyr'
#> The following objects are masked from 'package:stats':
#> 
#>     filter, lag
#> The following objects are masked from 'package:base':
#> 
#>     intersect, setdiff, setequal, union
DF <- read.csv("~/R/Play/Dummy.csv")
DF2 <- DF
DF2$NCORE_June_29_High <- DF2$NCORE_June_29
DF2 <- DF2 |> mutate(NCORE_June_29_High = ifelse(Wavelength > 405,NCORE_June_29_High,NA))
DF2$NCORE_June_29_Low <- DF2$NCORE_June_29
DF2 <- DF2 |> mutate(NCORE_June_29_Low = ifelse(Wavelength <= 405,NCORE_June_29,NA))

DF |> pivot_longer(NCORE_June_29:PILS_June_30) |> 
ggplot(aes(Wavelength, value)) +
  geom_point(aes(color = name)) +
  geom_smooth(aes(Wavelength, PILS_June_29), 
              data = DF2, color = "green", se = FALSE) +
  geom_smooth(aes(Wavelength, PILS_June_30), 
              data = DF2, color = "blue", se = FALSE) +
  geom_smooth(aes(Wavelength, NCORE_June_29_High), 
              data = DF2, color = "red", se = FALSE) +
  geom_smooth(aes(Wavelength, NCORE_June_29_Low), 
              data = DF2, color = "red", se = FALSE, linetype = 2)
#> `geom_smooth()` using method = 'loess' and formula 'y ~ x'
#> Warning: Removed 4 rows containing non-finite values (stat_smooth).
#> Warning in simpleLoess(y, x, w, span, degree = degree, parametric =
#> parametric, : span too small. fewer data values than degrees of freedom.
#> Warning in simpleLoess(y, x, w, span, degree = degree, parametric =
#> parametric, : pseudoinverse used at 429.4
#> Warning in simpleLoess(y, x, w, span, degree = degree, parametric =
#> parametric, : neighborhood radius 70.6
#> Warning in simpleLoess(y, x, w, span, degree = degree, parametric =
#> parametric, : reciprocal condition number 0
#> Warning in simpleLoess(y, x, w, span, degree = degree, parametric =
#> parametric, : There are other near singularities as well. 2560.4
#> Warning in simpleLoess(y, x, w, span, degree = degree, parametric =
#> parametric, : Chernobyl! trL>n 5

#> Warning in simpleLoess(y, x, w, span, degree = degree, parametric =
#> parametric, : Chernobyl! trL>n 5
#> Warning in sqrt(sum.squares/one.delta): NaNs produced
#> `geom_smooth()` using method = 'loess' and formula 'y ~ x'
#> Warning: Removed 5 rows containing non-finite values (stat_smooth).
#> Warning in simpleLoess(y, x, w, span, degree = degree, parametric =
#> parametric, : span too small. fewer data values than degrees of freedom.
#> Warning in simpleLoess(y, x, w, span, degree = degree, parametric =
#> parametric, : pseudoinverse used at 299.48
#> Warning in simpleLoess(y, x, w, span, degree = degree, parametric =
#> parametric, : neighborhood radius 65.525
#> Warning in simpleLoess(y, x, w, span, degree = degree, parametric =
#> parametric, : reciprocal condition number 0
#> Warning in simpleLoess(y, x, w, span, degree = degree, parametric =
#> parametric, : There are other near singularities as well. 3083
#> Warning in sqrt(sum.squares/one.delta): NaNs produced

Created on 2022-08-29 with reprex v2.0.2

2 Likes

that was amazing ,, thank you

Thanks for your valuable help!

I did it

DF2 <- wavelength01
head(DF2)

DF2$NCORE_June_29_High <- DF2$NCORE_June_29
head(DF2,10)

DF2 <- DF2 |> mutate(NCORE_June_29_High = ifelse(Wavelength >= 405,NCORE_June_29_High,NA))
head(DF2,10)

DF2$NCORE_June_29_Low <- DF2$NCORE_June_29
head(DF2,10)

DF2 <- DF2 |> mutate(NCORE_June_29_Low = ifelse(Wavelength <= 405,NCORE_June_29,NA))

head(DF2,10)

wavelength01 |> pivot_longer(NCORE_June_29:PILS_June_30) |> 
  ggplot(aes(Wavelength, value, color = name,group=1)) +
 geom_point() +
  geom_smooth(aes(Wavelength, PILS_June_29), 
              data = DF2, color = "chartreuse4", se = FALSE,size = 0.5) +
  geom_smooth(aes(Wavelength, PILS_June_30), 
              data = DF2, color = "blue", se = FALSE,size = 0.5) +
  
  geom_smooth(aes(Wavelength, NCORE_June_29_High), 
              data = DF2, color = "red", se = FALSE,size = 0.5) +
  geom_smooth(aes(Wavelength, NCORE_June_29_Low), 
              data = DF2, color = "red", se = FALSE, linetype = 3)+
  theme(legend.text=element_text(size=12)) + 
  theme(legend.title=element_blank()) +
  theme(legend.position = c(0.75, 0.7)) +
  theme(axis.title = element_text(face="plain",size=14,color="black"),
        axis.text=element_text(size=12,face="plain", color="black"),
        plot.title = element_text(size=15)) +
  #theme(panel.background = element_rect(colour = "black", size=1)) + 
  #theme(panel.background = element_rect(fill = "white")) +  
  #scale_color_brewer(palette="Set1")+
  ylab(bquote('Abs_Coeff ('*Mm^-1*')')) +
  xlab(bquote('Wavelength ('*nm*')')) +
  labs(title = "")+ ylim(0,100) 

This topic was automatically closed 21 days after the last reply. New replies are no longer allowed.

If you have a query related to it or one of the replies, start a new topic and refer back with a link.