I want to change the color of the fill items in a ggplot .
I know I can use like this
scale_fill_manual(values=c("A"="red","B"="blue")
is there a way to pass it something like this
scale _fill_manual(values=tibble(c("A,"B),c("red","blue"))
I want to change the color of the fill items in a ggplot .
I know I can use like this
scale_fill_manual(values=c("A"="red","B"="blue")
is there a way to pass it something like this
scale _fill_manual(values=tibble(c("A,"B),c("red","blue"))
To the best of my understanding, scale_fill_manual(values = ...) wants a vector.
However, if it is easier for you to create category-colour pairs in a dataframe, its not too tricky to turn it into a named vector.
I've also given an example of a function you could write to make this easier to do in future (could go in a personal package)
library(dplyr, warn.conflicts = FALSE)
library(ggplot2)
# plot
plot_dat <-
tibble(x = c("A", "B"),
y = c(2, 5))
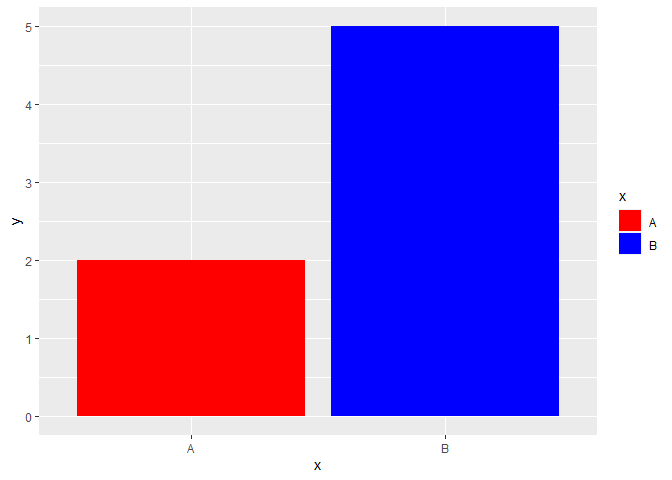
plt <- ggplot(plot_dat, aes(x,y)) + geom_col(aes(fill = x))
# colors
color_dat <-
tibble(cat = c("A", "B"),
col = c("red", "blue"))
cols <- rlang::set_names(color_dat$col, color_dat$cat)
plt + scale_fill_manual(values = cols)
# write a function to make it easier to do!

scale_fill_tbl <- function(cols_tbl, cat = "cat", col = "col"){

  scale_fill_manual(
    values = rlang::set_names(color_dat[[col]], color_dat[[cat]])
  )

}

plt + scale_fill_tbl(cols_tbl = color_dat)
Created on 2022-10-15 with reprex v2.0.2
Thanks a Lot Jack!! that was neat
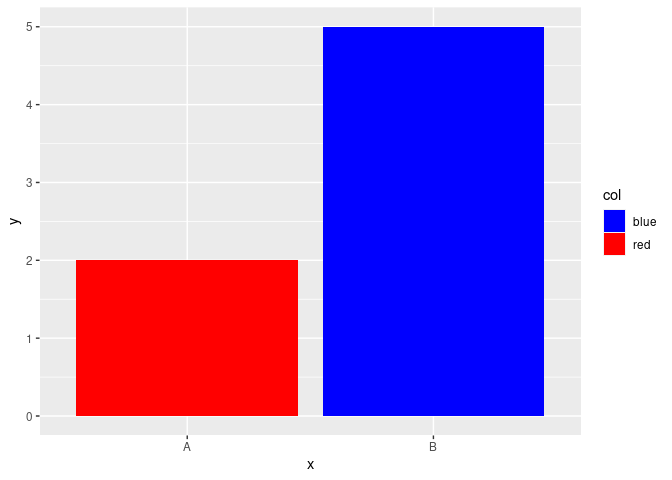
Just for variety's sake. You can also define color in your data itself and use scale_fill_identity()
library(dplyr)
library(ggplot2)

plot_dat <-
    tibble(x = c("A", "B"),
           y = c(2, 5))

color_dat <-
    tibble(cat = c("A", "B"),
           col = c("red", "blue"))

plot_dat %>%
    inner_join(color_dat, by = c(x = 'cat')) %>%
    ggplot(aes(x, y)) +
    geom_col(aes(fill = col)) +
    scale_fill_identity(guide = "legend")
Created on 2022-10-18 with reprex v2.0.2
This topic was automatically closed 21 days after the last reply. New replies are no longer allowed.
If you have a query related to it or one of the replies, start a new topic and refer back with a link.